Innovative Aerospace Solutions
We're designing a new 200kg VTOL drone, but have hit a problem with wing-propeller interaction. We need someone to help us understand
the issues - and then to help us scope out the range of solutions that are available to us.
Compendium of Results
The slides below summarise a few findings of potentially more general interest that we have extracted from our work on various projects* for various clients - we hope you find them interesting!
❮
more examples
❯
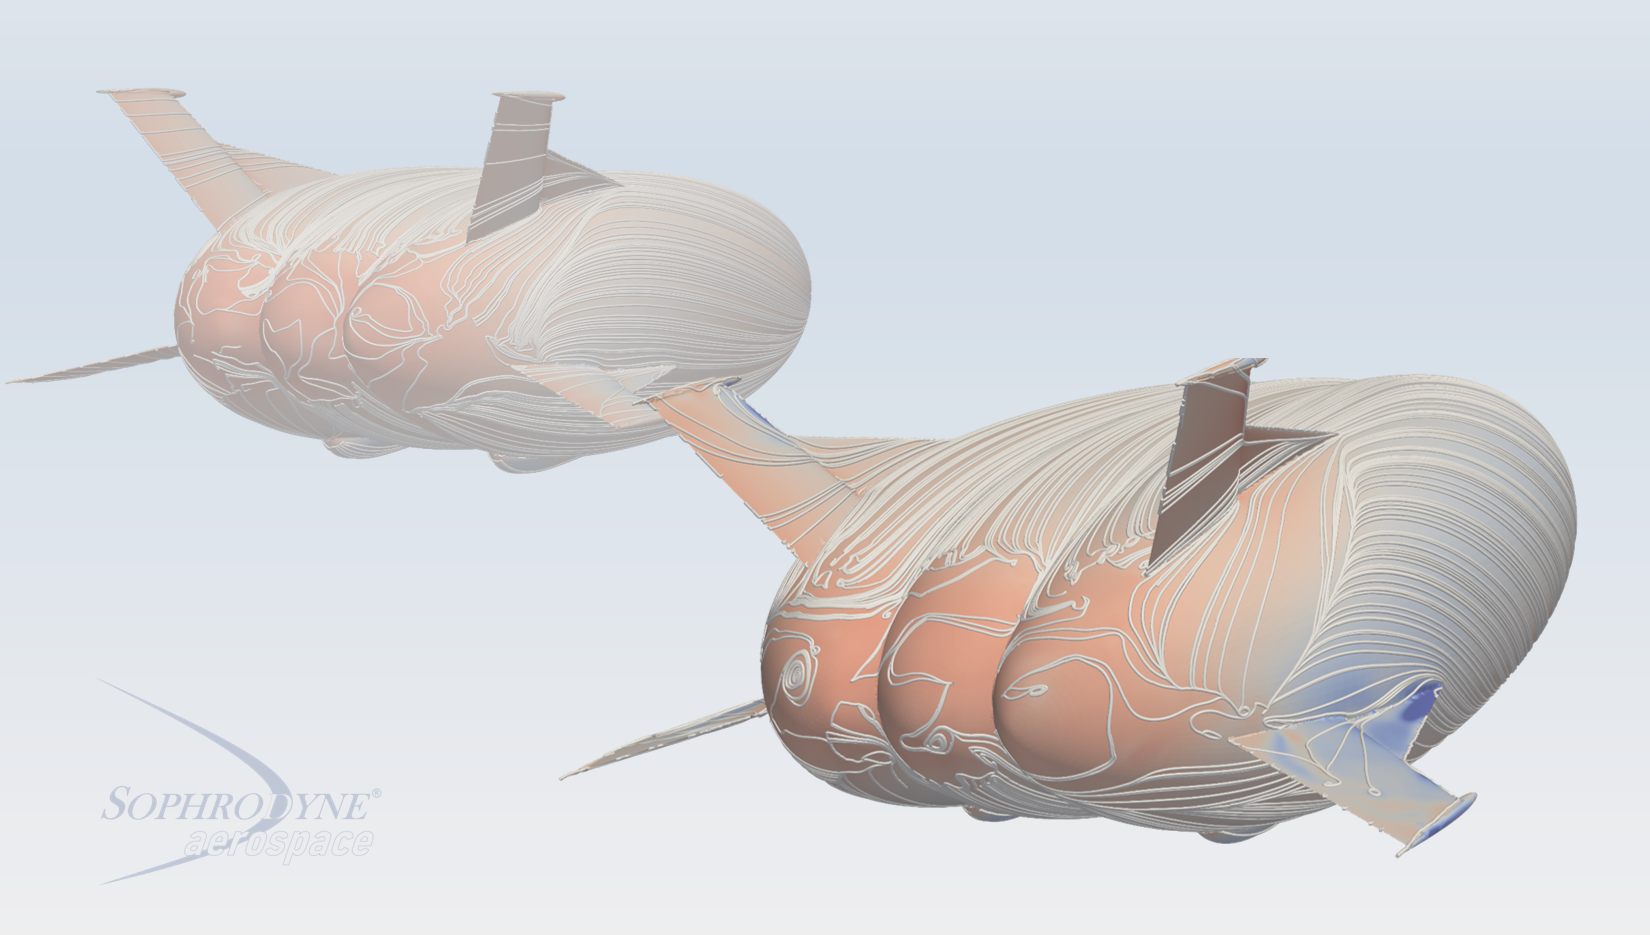
CFD-calculated shear lines on the surface of two hybrid airships flying at slightly different
angles of attack.
More information
Hybrid airships are different to conventional airships in that they depend to a greater extent on the lift that is generated in moving forwards through the air to sustain their flight. As a result, the performance and stability of hybrid airships can be strongly influenced by the degree to which the flow has separated over the surface of their envelopes.
This image shows the pattern of surface shear lines on the surface of two large, hybrid airships operating at slightly different angle of attack and with a small amount of yaw. The CFD simulation shows the flow to have separated over a significant proportion of the rear of both vehicles. The increase of pressure in these regions of separated flow could on its own lead to significant loss of lift and a de-stabilizing nose-up pitching moment about the centre of gravity of the vehicle, especially if, as shown here, the extent of the separation was to change markedly with angle of attack.
With the vehicles shown in the image, these effects are offset to a considerable extent by the design of the tail surfaces - in particular the strakes at their roots allow these surfaces to continue to produce sizeable forces with the vehicles in the flight conditions as shown, contributing both to the lift and to a stabilising nose-down pitching moment about the centre of gravity of the vehicle.
❮
more examples
❯
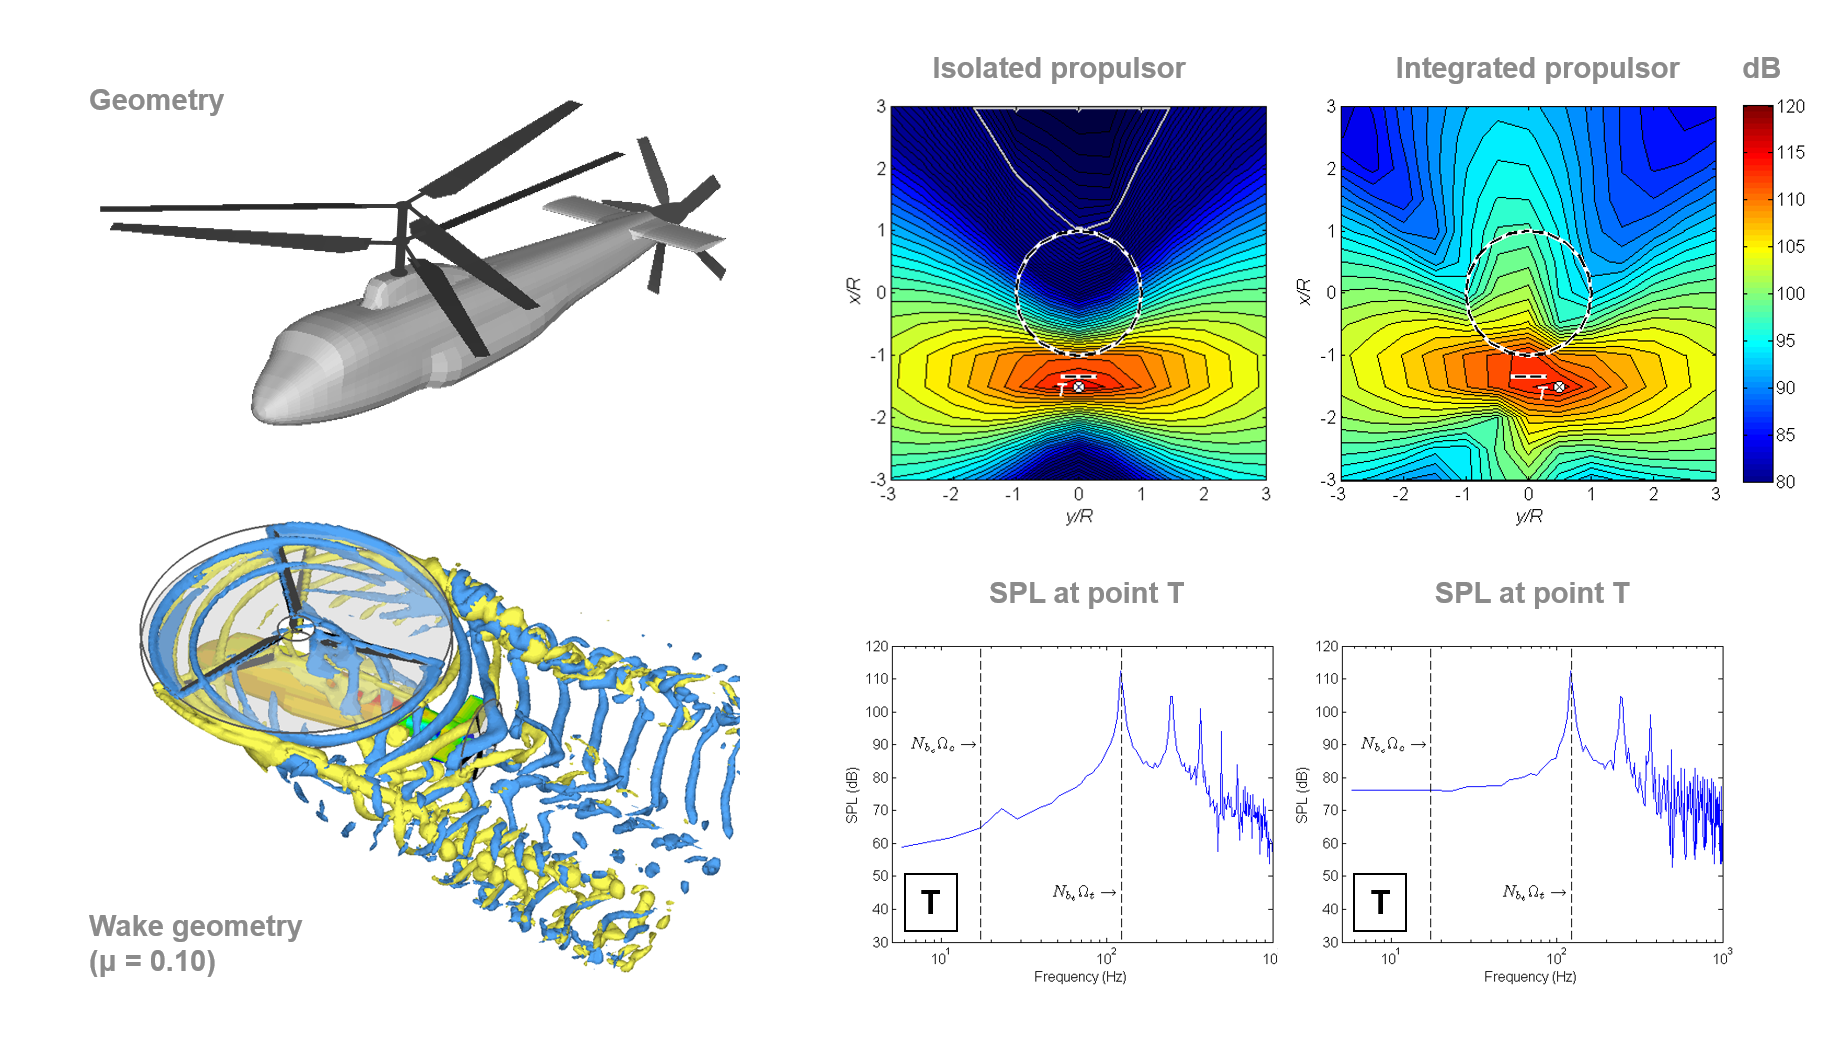
Estimate of the noise that is radiated from the rear-mounted propulsor of a thrust-compounded
coaxial helicopter.
More information
A problem that is often encountered with helicopters and other aircraft that are designed for vertical takeoff and landing is the impingement of the wake produced by the propulsion system on some part of the airframe over a range of flight speeds or with the aircraft at certain attitudes to the oncoming flow. These aerodynamic interactions are associated with unexpected trim changes, noise, vibration, and a range of other more-or-less subtle, but nonetheless unwanted, physical effects on the airframe.
This figure shows the results of a computational analysis of the aerodynamic interactions that might be present in a very compact helicopter design that has a stiff, coaxial main rotor together with a tail-mounted propulsor to provide thrust in forward flight. Longitudinal stability and trim of the helicopter is augmented by a tailplane that is mounted on the fuselage just forward of the propulsor.
The diagrams at top right show the directivity of the sound that is radiated by the propulsor that is mounted at the rear of the configuration shown at top left. The isolated propulsor would be expected to radiate most of its sound directly outwards and downwards away from the vehicle. The aerodynamic interaction with the main rotor (as shown in the diagram at bottom left) that takes place when the propulsor is integrated into the design results in a strong component of radiation that is directed along the flightpath of the vehicle, however.
In practice this feature of the design would increase the exposure of those who live underneath the intended fightpath of the vehicle to its noise - rendering the design perhaps less acceptable in certain specific applications than an alternative configuration. The diagrams at bottom left show also how the aerodynamic interactions within the system are responsible for increased radiation of energy at the higher end of the acoustic spectrum, particularly as a series of distinct tones between 500 and 1000Hz. Many people find noise in this range of frequencies quite intrusive and objectionable, and some re-work of the design might be warranted in order to lessen its acoustic impact on its environment.
❮
more examples
❯
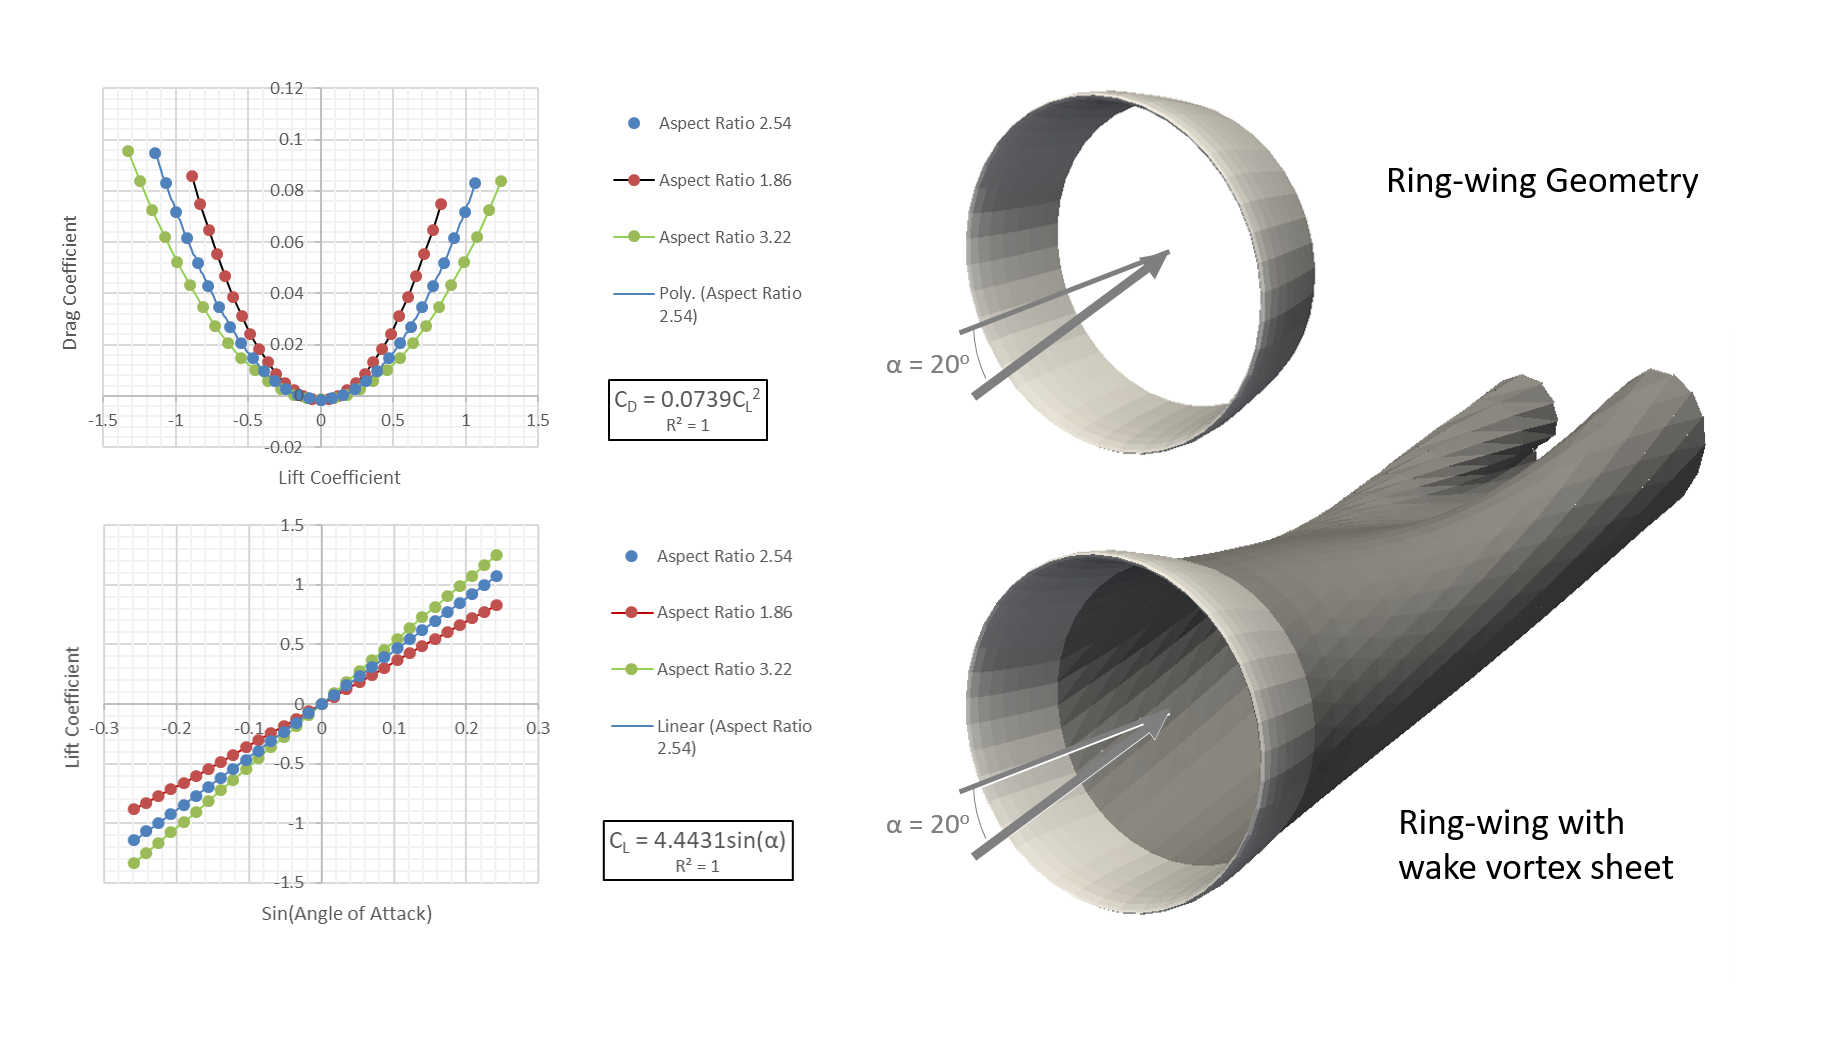
Lift and drag coefficients, as predicted using the vortex lattice method, of a prospective
ring-shaped wing geometry for a particular drone application.
More information
Modern advancements in cheap electronics and electric propulsion have allowed drone designers the freedom to explore many novel configurations for their vehicles, and indeed to re-consider many aerodynamic ideas that have been dismissed in the past as impractical. One such idea is to use ring-shaped wings, rather than conventional planar wings, as part of an integrated, compact, and structurally strong airframe that is well-adapted to vertical takeoff and landing.
The figures show the results of a parametric study of the effect of aspect ratio (in this case duct diameter divided by duct chord) on the induced drag polar and the lift coefficient of a ring-wing as a function of its angle of attack. In order to capture the performance of the system with the greatest fidelity, the free-wake option within our panel code, called VORLAT-II, was used to include the secondary effects on the lift and drag of the self-induced distortion (as shown at right) of the wake downstream of the wing.
The results of this study were used to support a design-stage decision for a prospective drone that hinged on the relative merits of the ring-wing configuration compared to a more conventional wing design. In this case, VORLAT-II was able to provide objective, quantitative information that allowed the designers to make an informed and rational decision to adopt this rather unusual and somewhat untried concept as the core of their new design.
❮
more examples
❯
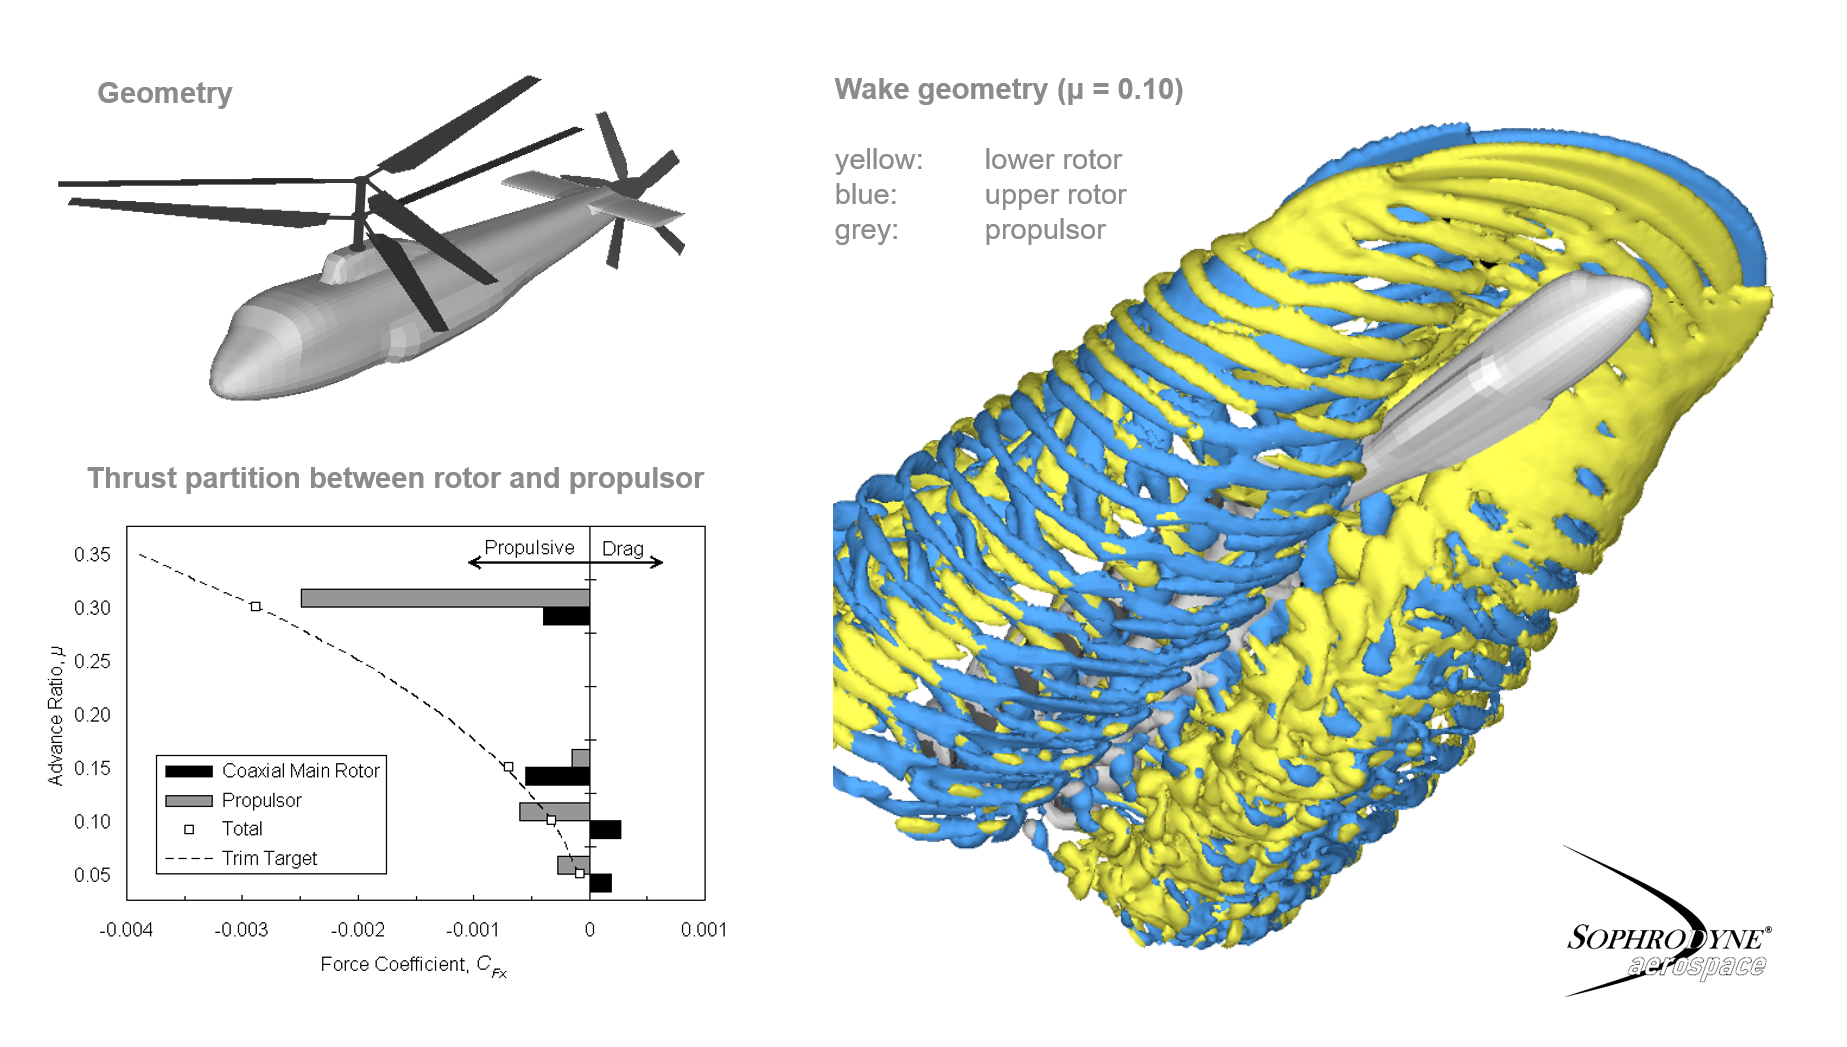
Wake geometry and and associated partitioning of the thrust between the rotors of a compound-coaxial
helicopter, as predicted by the VTM.
More information
A problem that is often encountered with helicopters and other aircraft that are designed for vertical takeoff and landing is the impingement of the wake produced by the propulsion system on some part of the airframe over a range of flight speeds or with the aircraft at certain attitudes to the oncoming flow. These aerodynamic interactions are associated with unexpected trim changes, noise, vibration, and a range of other more-or-less subtle, but nonetheless unwanted, physical effects on the airframe.
This figure shows the results of a computational analysis of the aerodynamic interactions that might be present in a very compact helicopter design that has a stiff, coaxial main rotor together with a tail-mounted propulsor to provide thrust in forward flight. Longitudinal stability and trim of the helicopter is augmented by a tailplane that is mounted on the fuselage just forward of the propulsor.
The interaction between the wakes from the two main rotors, the propulsor at the rear, and the horizontal stabiliser of this complex rotorcraft design is clearly apparent in the diagram at right. The diagram at bottom left shows how the changing nature of this interaction strongly influences the relative contribution to the overall thrust that each rotor must make as the forward speed of the helicopter is increased. A particular problem with this design is evident at low forward flight speed (i.e. at advance ratios less than 0.10) where, in order to trim the vehicle, the main rotor must provide a force that is in opposition to that provided by the propulsor.
Capturing effects such as this requires accurate characterisation of the aerodynamics of the vehicle down to a very fine level of detail. It is clear that, in the example presented here, the design will likely consume more power in practice than might have been suggested by a more simplistic analysis where, for instance, the effects of the aerodynamic interactions between the components of the aircraft were neglected.
❮
more examples
❯
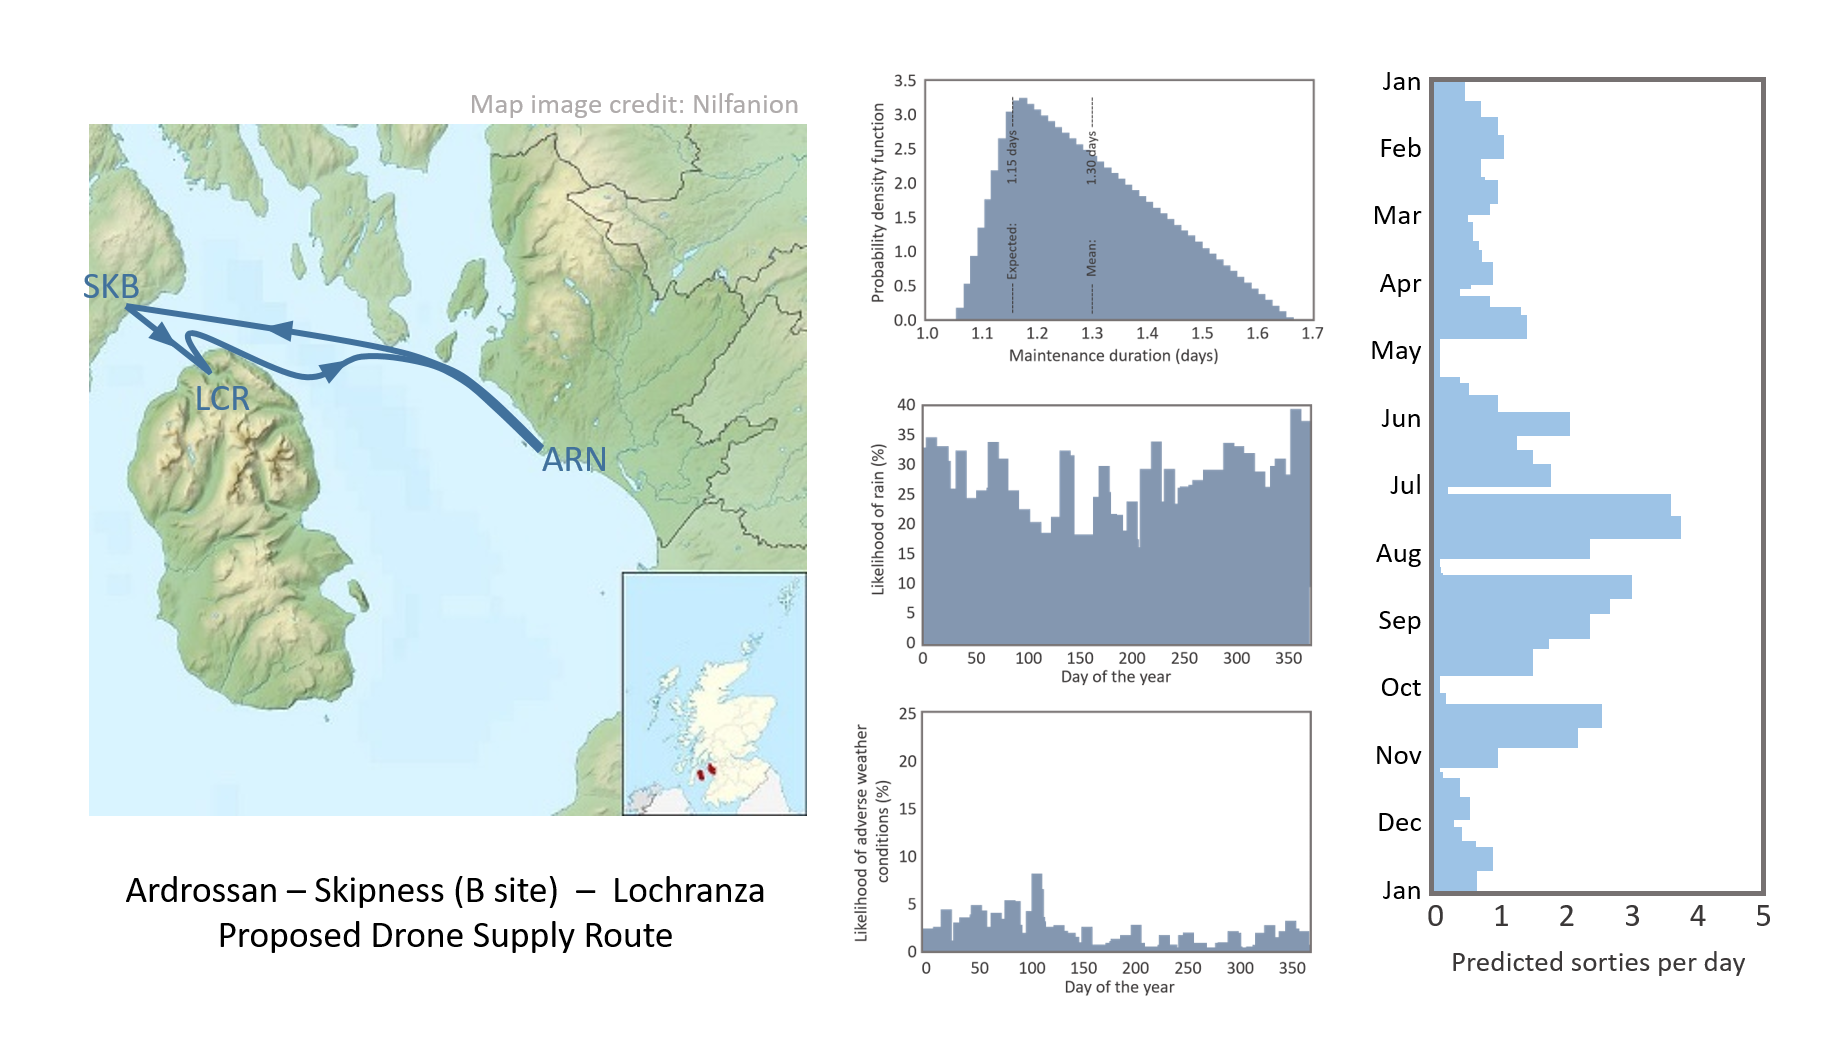
A prediction of the likely sortie rate for a coastal delivery service when the effects of
weather and the need for regular maintenance of the fleet are taken into account.
More information
A particular consideration in the design of an effective business model for drone operations, particularly in the harsh climatic conditions of the Western Isles of Scotland, is how the weather will affect the ability of the business to operate to schedule with a fleet consisting of a given number of vehicles. The figure shows the results of a statistical analysis of the likely operational tempo of a fleet of drones on a particular route, when subjected to the weather conditions that have been experienced historically in that geographical area.
The predictions show the clear influence of weather conditions on the likely rate of operations on the intended route. During the summer, the rate of operations is likely to be able to increase quite markedly compared to the winter, when rain and bad weather will severely limit the ability of the service to operate.
The predictions show also a very interesting 'boom and bust' dynamic, where the maintenance cycle is unable to keep up with the rate of operations during the summer given the proposed size of the fleet. The simulations show that periods of busy activity will be brought to a sudden halt as a maintenance backlog causes the availability of serviceable aircraft to decline.
In this case our in-house operational analysis software was then used to help explore various potential solutions to this problem, eventually allowing an economical operational strategy to be devised for the drone fleet that enabled rather than constrained the operator's intended business model.
❮
more examples
❯
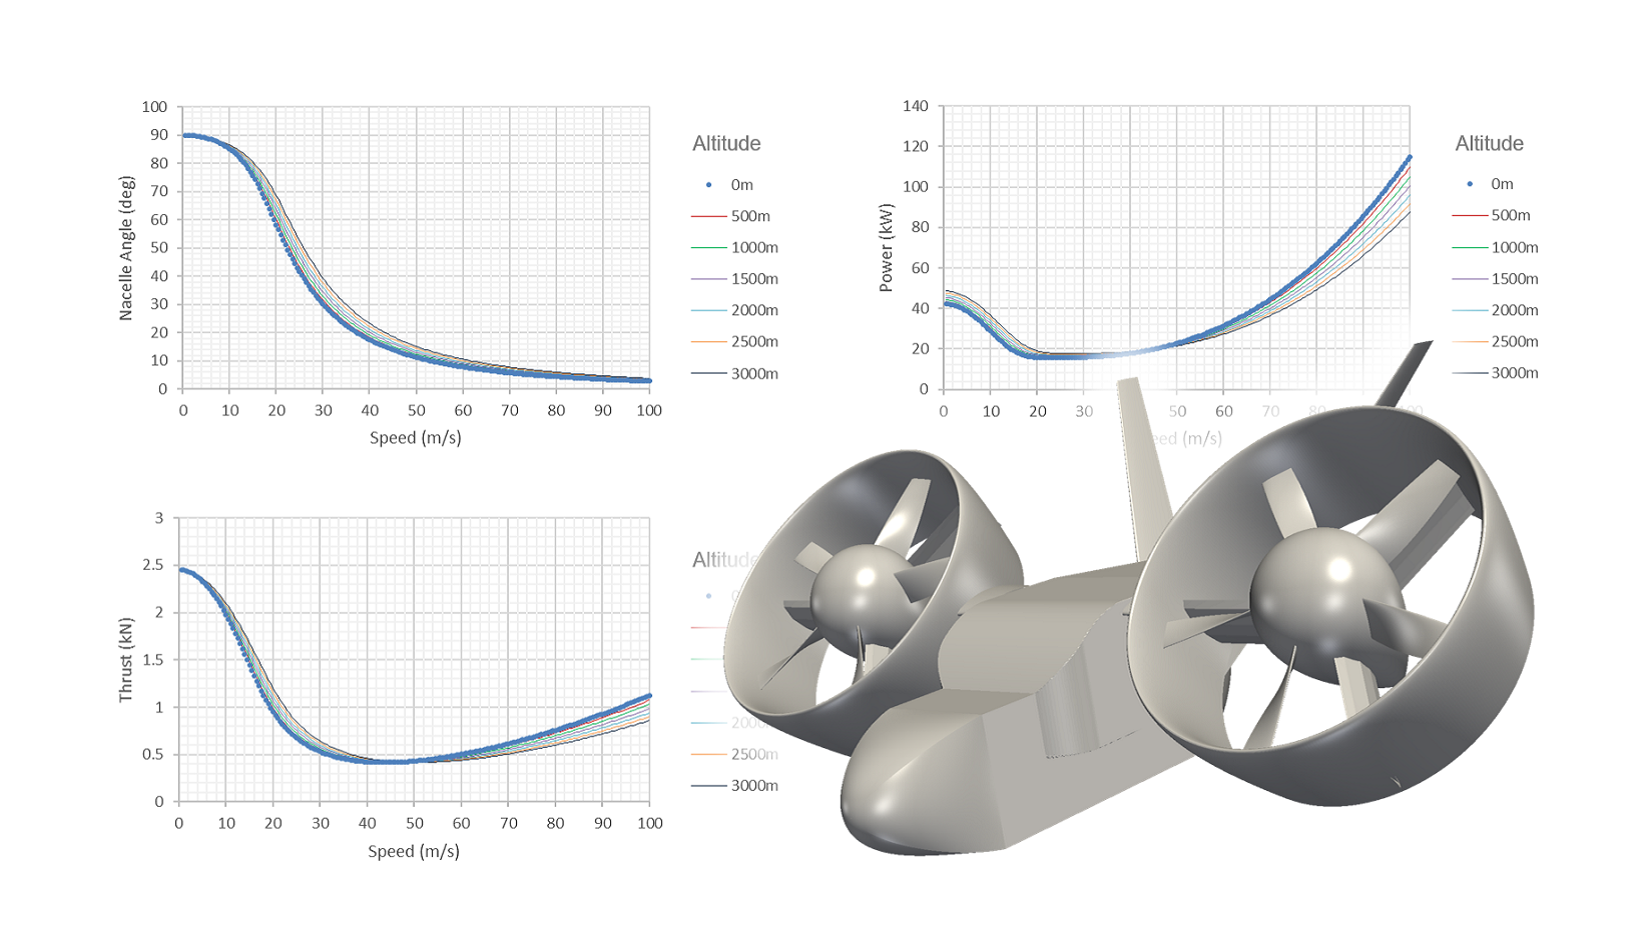
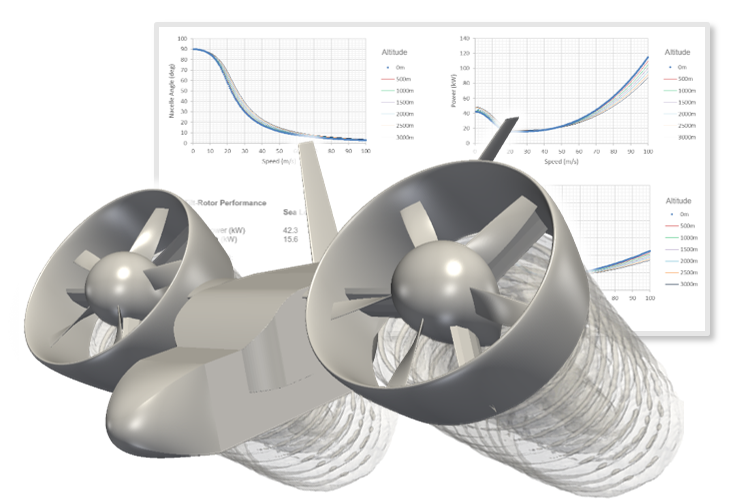
Performance characteristics of a tilt-rotor drone as a function of forward speed and altitude.
More information
A particularly difficult problem in the design of aircraft that are intended to have the capability to land and take off vertically is to properly match the power requirements of the vehicle in hover to those at the maximum required forward flight speed of the vehicle, while at the same time maintaining all the forces and moments on the aircraft in equilibrium across the entire operational speed range of the vehicle. The figure shows calculated results for the performance of a tilt-rotor drone, in which the propellers can be vectored forward to provide thrust, or pointed upwards to augment the lift of the wing as the forward speed of the vehicle is varied.
The diagram at top left shows how the forward tilt of the propellers of the drone needs to vary with flight speed in order to maintain the aircraft in steady flight at a given altitude. The diagram at bottom left similarly shows the thrust that is required. This information is combined in the diagram at top right to show the power that is required by the aircraft to maintain flight at any given speed and altitude. Once the characteristics of the propulsion system have been specified in a little more detail, the likely range and endurance of the vehicle can then be estimated.
The data presented here reinforces the notion that a proper assessment of the effects of altitude on performance is often vital. Operating conditions in the highlands of Kenya can pose significant difficulties for a drone that has been designed with only ISA sea-level conditions in mind!
❮
more examples
❯
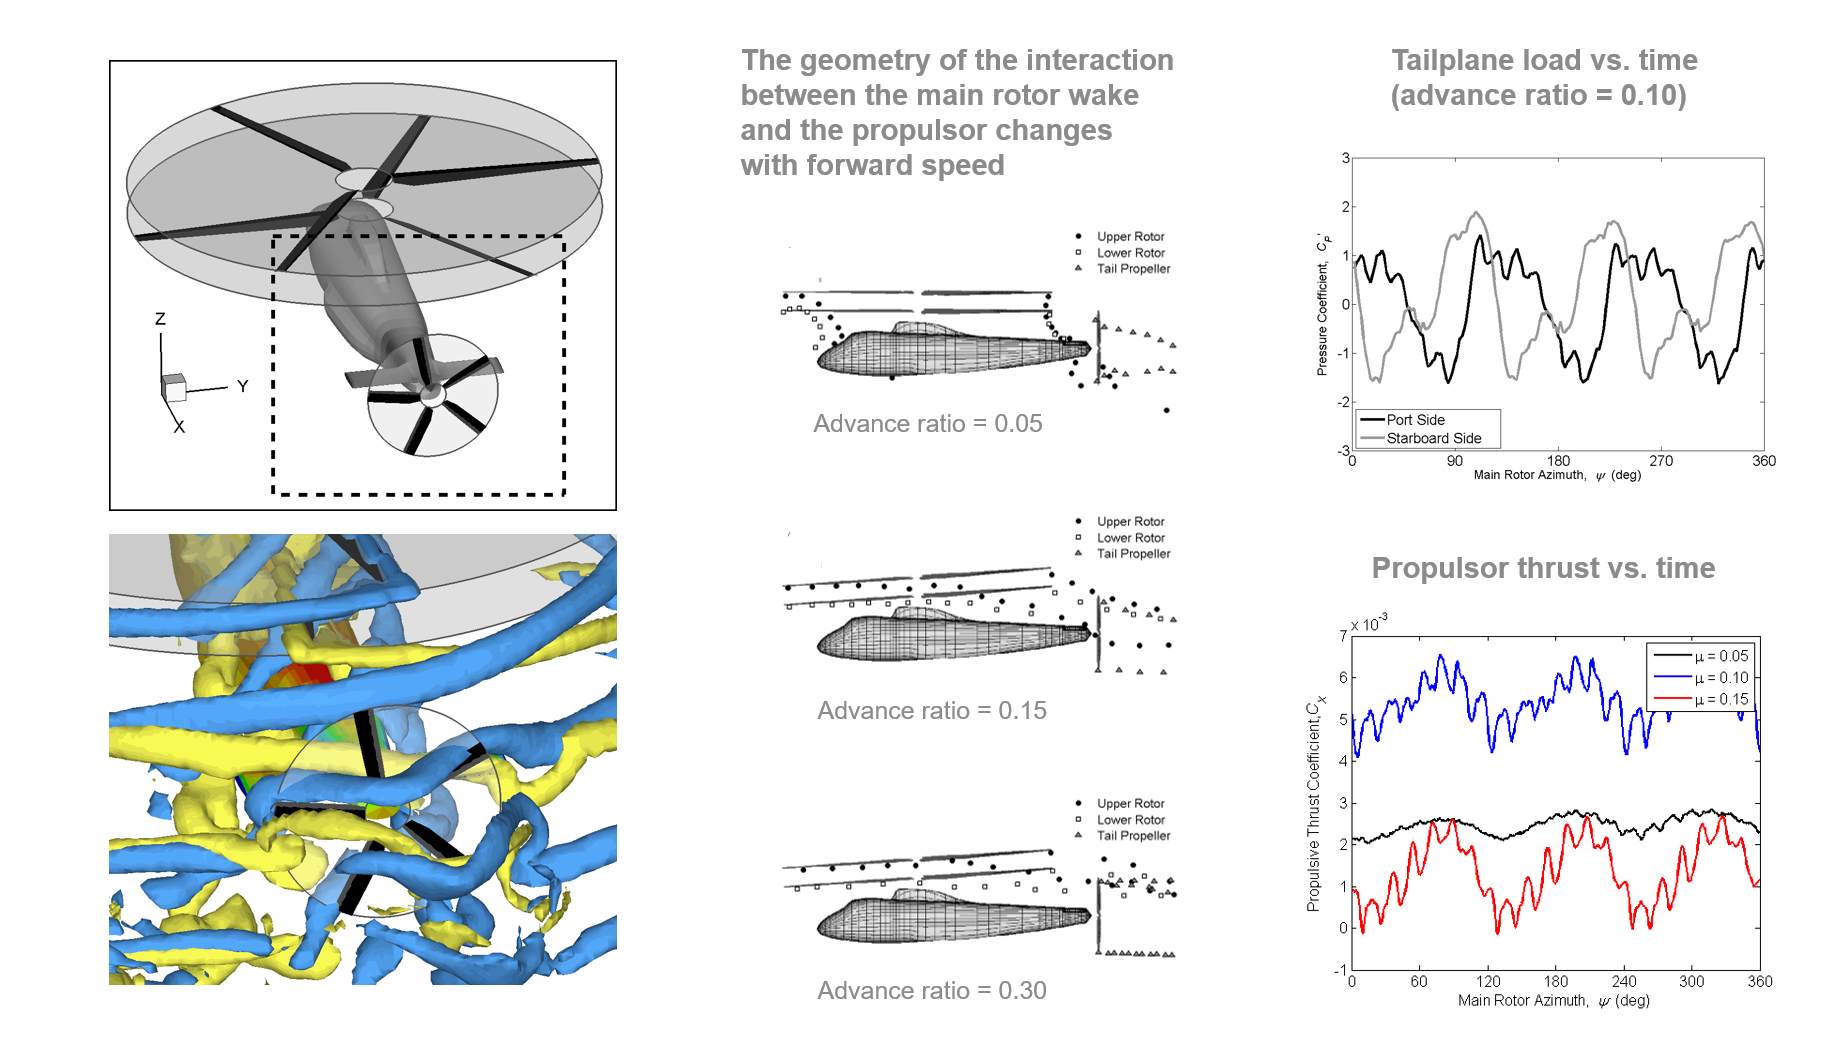
Calculations of the unsteady aerodynamic loads that are experienced by the tailplane and the
rear-mounted propulsor of a thrust-compounded coaxial helicopter.
More information
A problem that is often encountered with helicopters and other aircraft that are designed for vertical takeoff and landing is the impingement of the wake produced by the propulsion system on some part of the airframe over a range of flight speeds or with the aircraft at certain attitudes to the oncoming flow. These aerodynamic interactions are associated with unexpected trim changes, noise, vibration, and a range of other more-or-less subtle, but nonetheless unwanted, physical effects on the airframe.
This figure shows the results of a computational analysis of the aerodynamic interactions that might be present in a very compact helicopter design that has a stiff, coaxial main rotor together with a tail-mounted propulsor to provide thrust in forward flight. Longitudinal stability and trim of the helicopter is augmented by a tailplane that is mounted on the fuselage just forward of the propulsor.
The diagrams in the centre of the figure show parts of the wakes of the main rotors to impinge directly on the tailplane and to pass straight through the propulsor when the vehicle is operated over a narrow range of flight speeds (centred on an advance ratio of about 0.1).
The diagram at bottom left shows the character of this aerodynamic interaction in more detail - a succession of vortices from the blades of the main rotor can be seen passing over the tailplane before being ingested through the propulsor. The figures at right show the effects of this aerodynamic interaction on the lift that is generated by the tailplane as well as on the thrust that is generated by the propulsor.
Although the amplitude of the forces on these components of the vehicle varies with flight speed, there is in all cases a significant cyclical component. The cyclical nature of the loading needs to be carefully considered not only in terms of its effect on the dynamics and vibration of the vehicle, but also on the susceptibility of parts of the aircraft to damage, or even failure, through fatigue.
❮
more examples
❯
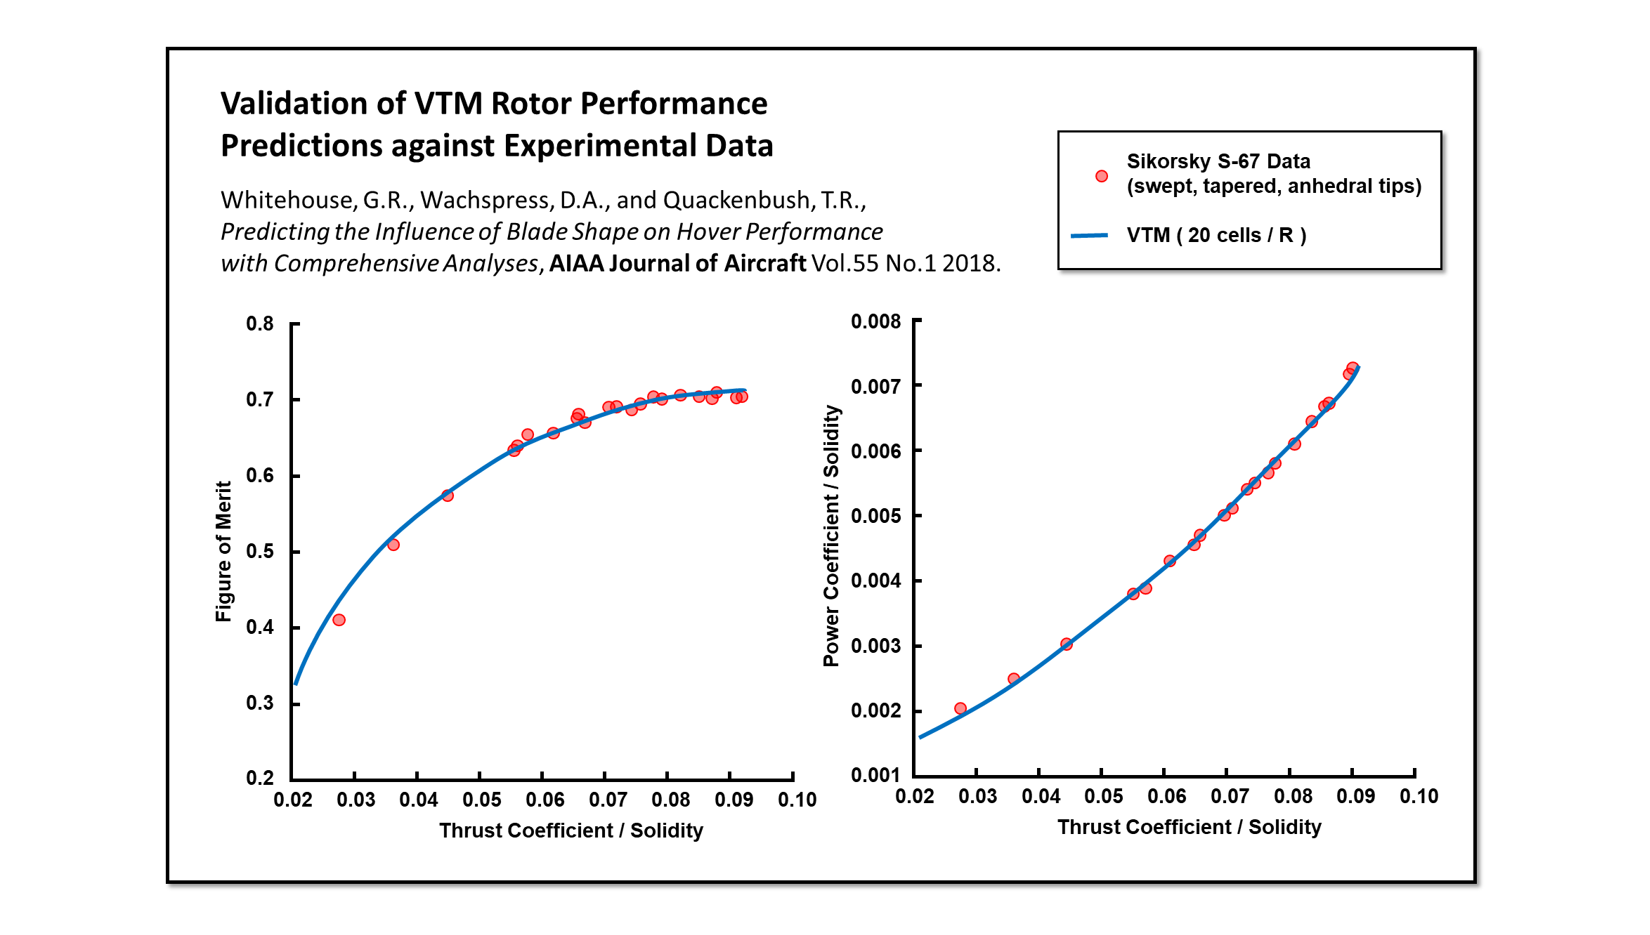
Verification of the VTM's predictions of rotor performance in hover.
More information
Predicting accurately the power that is required to hover a helicopter rotor at a given thrust can be a difficult task, especially if the blades of the rotor have anything other than the simplest geometry. The shape of the blade tips, in particular, can have a strong influence on the local aerodynamics as well as on the manner in which the vorticity leaves the blade to form the initial elements of the rotor wake.
The blade aerodynamic model within the VTM has been developed with real engineering applications in mind. Unlike the usual CFD-type approaches to rotor modelling - which have to rely on the intrinsic accuracy of their representation of the basic flow physics to achieve acceptable results, the VTM uses a combination of analytic models, experimental data and specialised numerical routines, derived through years of engineering experience, to represent accurately the effects of sweep, anhedral, compressibility and local unsteadiness in the flow on the local aerodynamic loads.
Sikorsky's experimental data set for the hover performance of their S-76 rotor provides a tough challenge for most numerical rotor models, as the tips of the blades of this rotor have appreciable sweep and anhedral. The figure compares VTM predictions of the power required by the S-76 rotor as well as its efficiency (as expressed by its figure of merit) against this experimental data as a function of the thrust that the rotor is required to produce.
The level of agreement between the VTM's predictions and the experimental data is as good as, or better than, that obtained with almost all other numerical models that have been used to try to replicate this particular set of experimental data. We ascribe the success of the VTM to two essential factors. First of all its fundamentally pragmatic formulation - where appropriate phenomenological modelling is used in place of a first-principles based physics approach, particularly where this yields the most concise and accurate formalism, or a direct solution of the fundemental fluid dynamic equations becomes slow, inaccurate or inefficient, and, secondly, the years of experience, development, verification and validation that have gone into the construction of the code.
The VTM is too specialised a tool to be run 'out of the box' by a novice - but, in the hands of an expert practitioner, it becomes a powerful engineering tool that is capable of yielding deep insights into the likely aerodynamic behaviour of many diverse aeronautical systems.
❮
more examples
❯
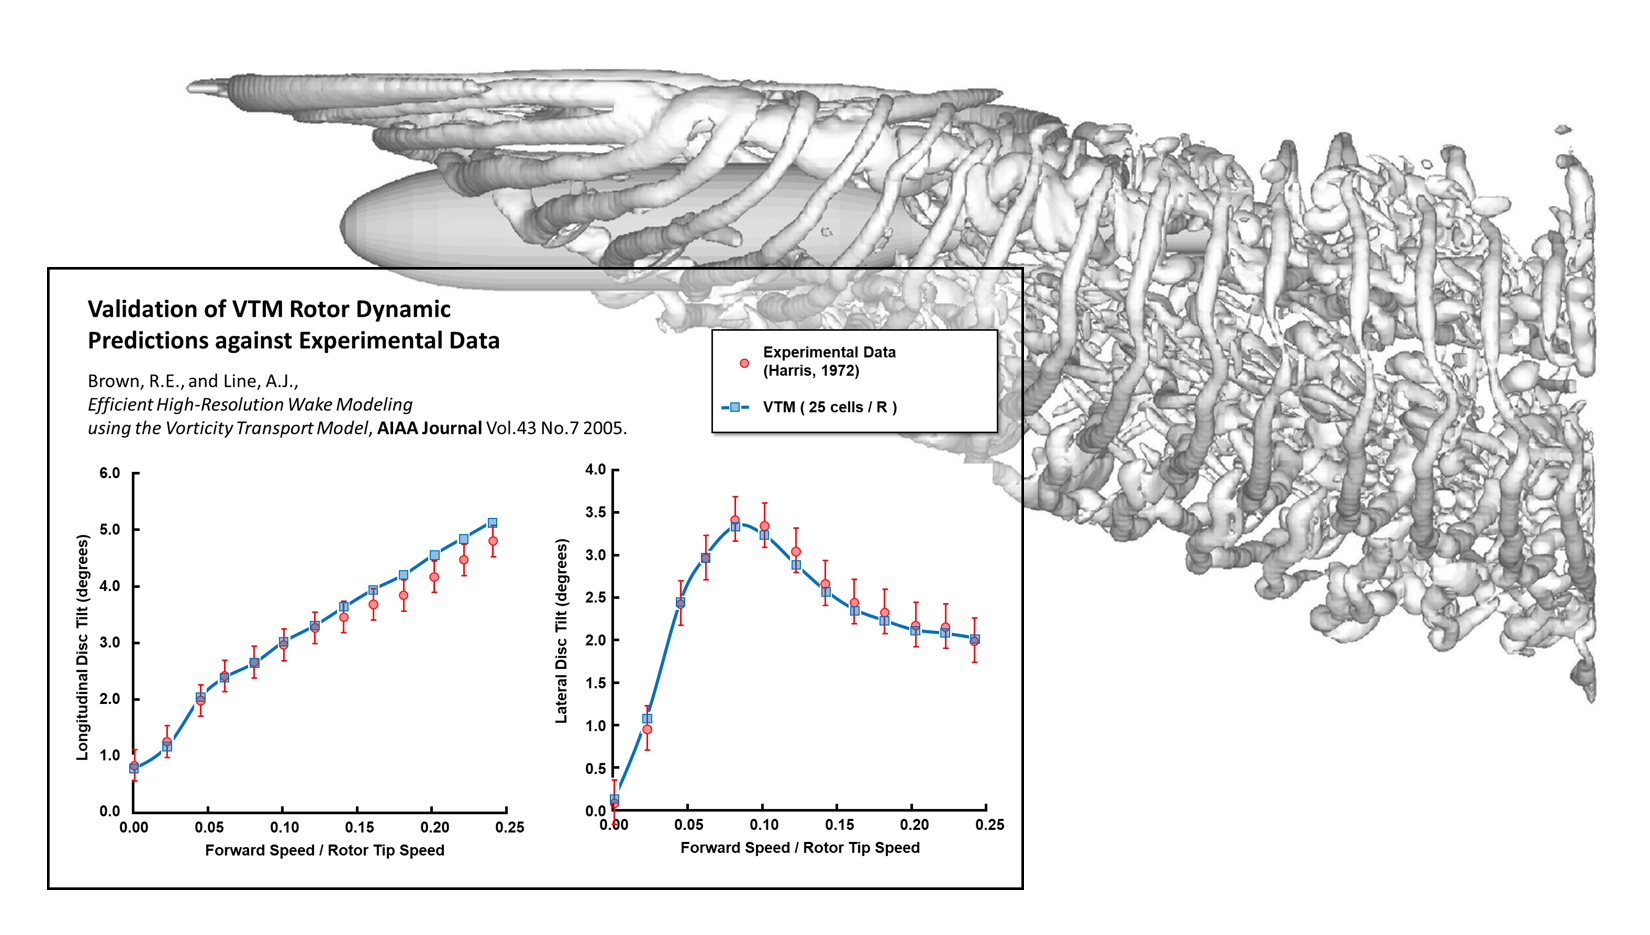
Verification of the VTM's rigid-blade dynamic model.
More information
The way that the blades of a helicopter rotor behave dynamically is fundamentally governed by the distribution of aerodynamic load along the length of the blades and how this changes with the position of the blades as they rotate around the rotor hub. The local aerodynamic loads are governed by the angle of attack of the blades, and hence rather strongly by the local velocity of the air downwards through the rotor disc (that is, by the local 'inflow').
Accurate prediction of the blade dynamics is thus heavily reliant on accurate prediction of the distribution of the inflow along the rotor blades at the flight condition of interest. Accurate prediction of the inflow is no easy task, as its distribution over the rotor disc is in turn dependent on the strength and geometry of the rotor wake. The strength and geometry of the wake is of course dependent on the aerodynamic loads being generated on the rotor blades. The process of predicting the dynamics of the rotor blades is thus inherently circular.
Successful verification of the dynamic behaviour of the rotor blades against trustworthy experimental data thus forms one of the most powerful checks of the internal consistency and physical quality of any numerical method that has been designed to simulate the behaviour of rotors and rotorcraft. One of the best sets of data in this respect against which to compare the predictions of a numerical rotor model are the wind-tunnel measurements of the longitudinal and lateral flapping of an isolated model rotor as a function of forward speed that were obtained by Harris in 1972.
The figure shows a comparison of of Harris's longitudinal and lateral flapping data against the predictions of our Vorticity Transport Model. The VTM predictions of the lateral flapping of the rotor are within the experimental error bounds across the entire speed range. The numerical predictions of the longitudinal flapping of the rotor, although matching the measurements very well, do show a slight systematic divergence from the experimental data as the forward speed of the rotor is increased. Based on our experience with other, similar test cases, our best guess for the moment is that this is due to a Reynolds number effect in the stalling behaviour of the aerofoil sections at the roots of the blades that we were unable to account for fully in the model.
❮
more examples
❯
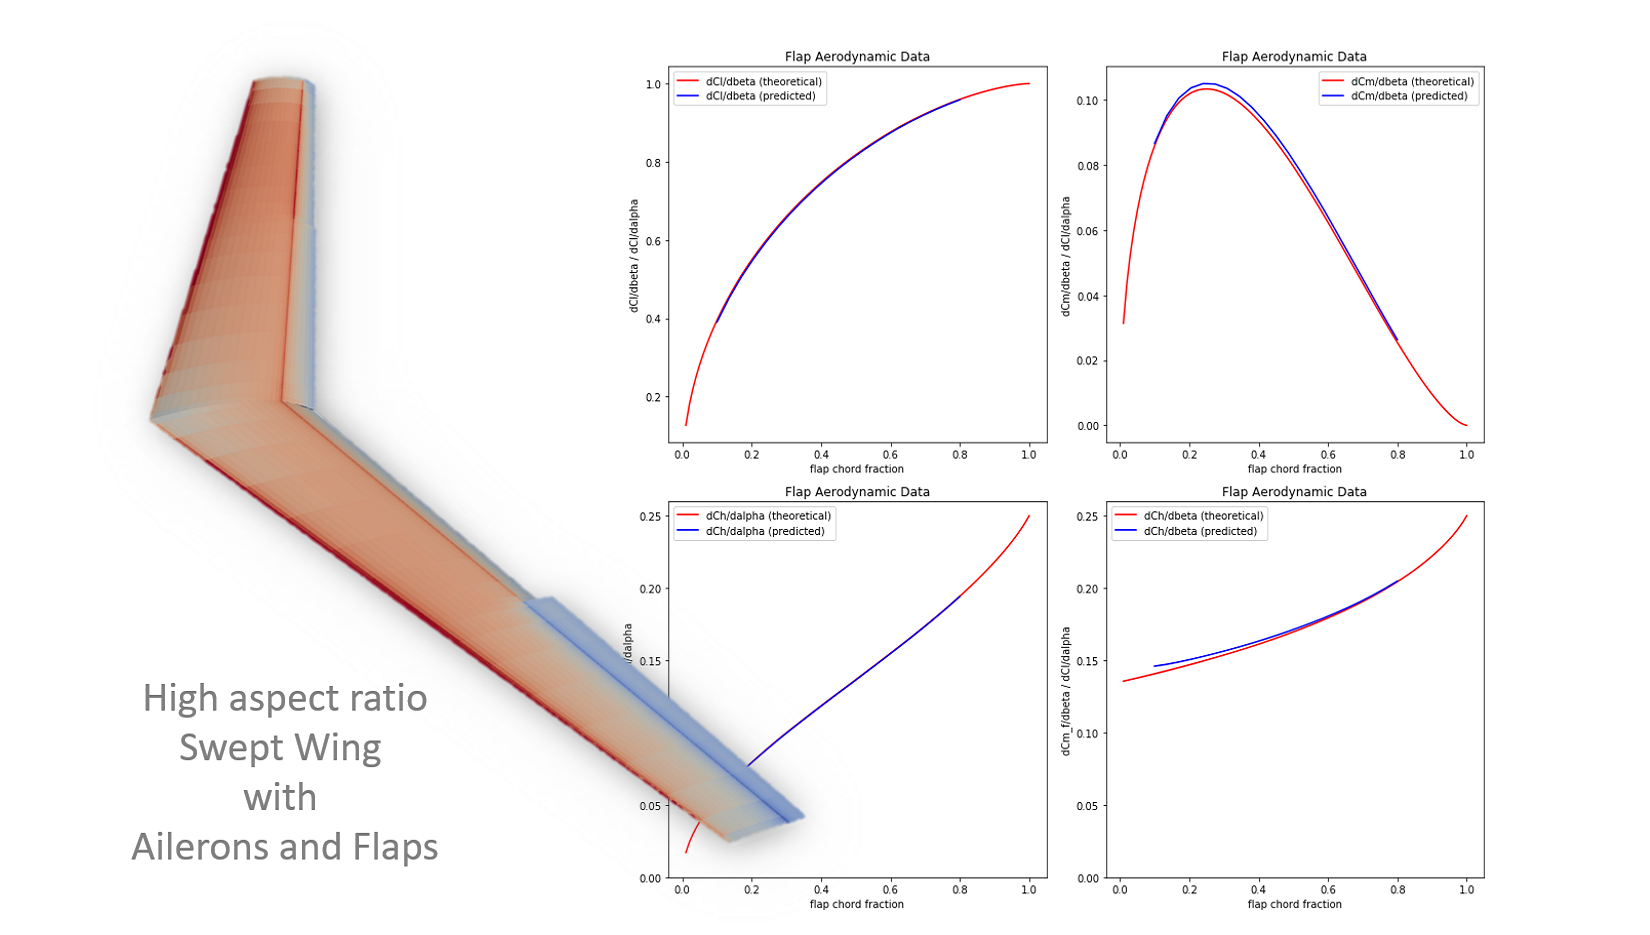
Numerically-predicted control surface derivatives for a trailing-edge flap compared to theoretical
results.
More information
One source of material that is very often neglected when it comes to the verification of numerical models is the very large body of analytical results that was generated by the pioneers of aeronautical science in the 1920s and 1930s. Subjects such as conformal mapping and thin aerofoil theory, once part of a basic aeronautical education, have even slipped from the syllabus in many universities. Yet if a numerical model can be stripped down to its bare basics so that it conforms to the various assumptions made in the derivation of the analytical results that arise from one of these older methodologies, then a very powerful verification of the numerical model can be achieved by comparing its predictions against the appropriate theoretical results.
The figure shows the variation, as a function of the chord of the flap relative to the chord of the aerofoil, of the major control surface derivatives for a flap with infinite span, mounted at the trailing edge of a flat-plate aerofoil. Thin-aerofoil theory provides analytic expressions for these derivatives, and in the figure these results are compared against the predictions of a pared-down version of our VORLAT-II panel method where the wake dynamics have been suppressed and the geometric representation of the aerofoil has been brought as closely into line as is reasonably possible with the assumptions of the theory.
The pared-down numerical method produces predictions that are very closely in line with the predictions of the theory - the major discrepancies are found when the flap chord becomes a very small proportion of the overall chord of the aerofoil, and the thin-aerofoil assumptions made in the derivation of the theory are violated locally.
❮
more examples
❯
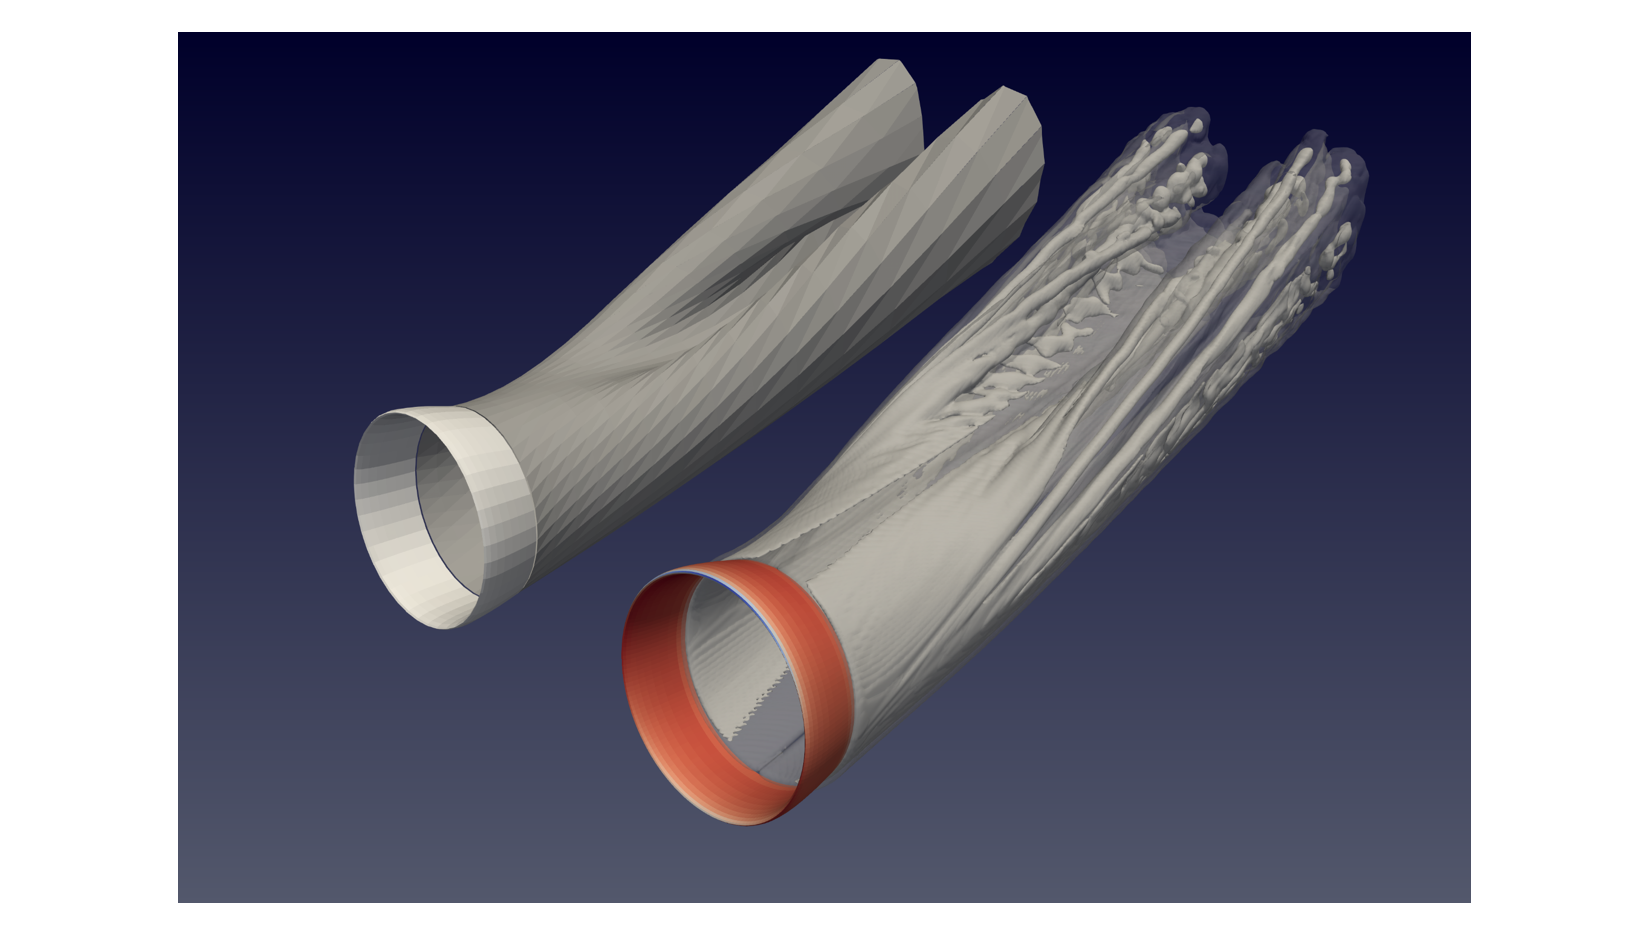
Geometry of the wake of a ring wing, as calculated using our free-wake panel method (left)
and the Vorticity Transport Model (right).
More information
A very effective method of gaining confidence in one's understanding of an aerodynamic problem is to repeat one's analysis using several disparate methodologies and to then compare and contrast their predictions. In the best of worlds, the methodologies will all give identical results, but it is more often the case that different techniques expose different facets of the same problem.
The figure above shows the results of two independent calculations of the wake that is produced by a simple, isolated ring-wing when operating at a moderate angle of attack. The diagram at left is produced using our VORLAT-II panel method, with its free-wake option switched on in order to capture a representation of the roll-up of the wake downstream of the wing. The diagram at right shows the wake structure of the same wing as predicted using our Vorticity Transport Model.
Both methodologies represent very well the gross behaviour of the wake dowstream of the wing in collapsing from its initially cylindrical shape to form a more compact, tightly-wound structure in which the trailed vorticity appears to be coalescing to form two, large, counter-rotating 'tip vortices' analogous to the structures found in the wake of a planar wing. The VTM exposes additional structure in the wake, however. The cylindrical sheet of vorticity that is created at the trailing edge of the wing appears to be subject to an additional, more local instability, not seen in the VORLAT-II analysis, which causes it to braid very quickly into a series of individual, compact vortex cores. These then wind around each other to form the large, coherent 'trailing vortices' downstream of the wing.
Although these braided vortices look very much like the product of a classical shear-layer instabiity, the first question the cautious modeller always asks themselves when encountering such features in their numerical solutions is 'is this instability numerical in origin, or is it physical?'
This question is addressed in the next slide in this sequence!
❮
more examples
❯
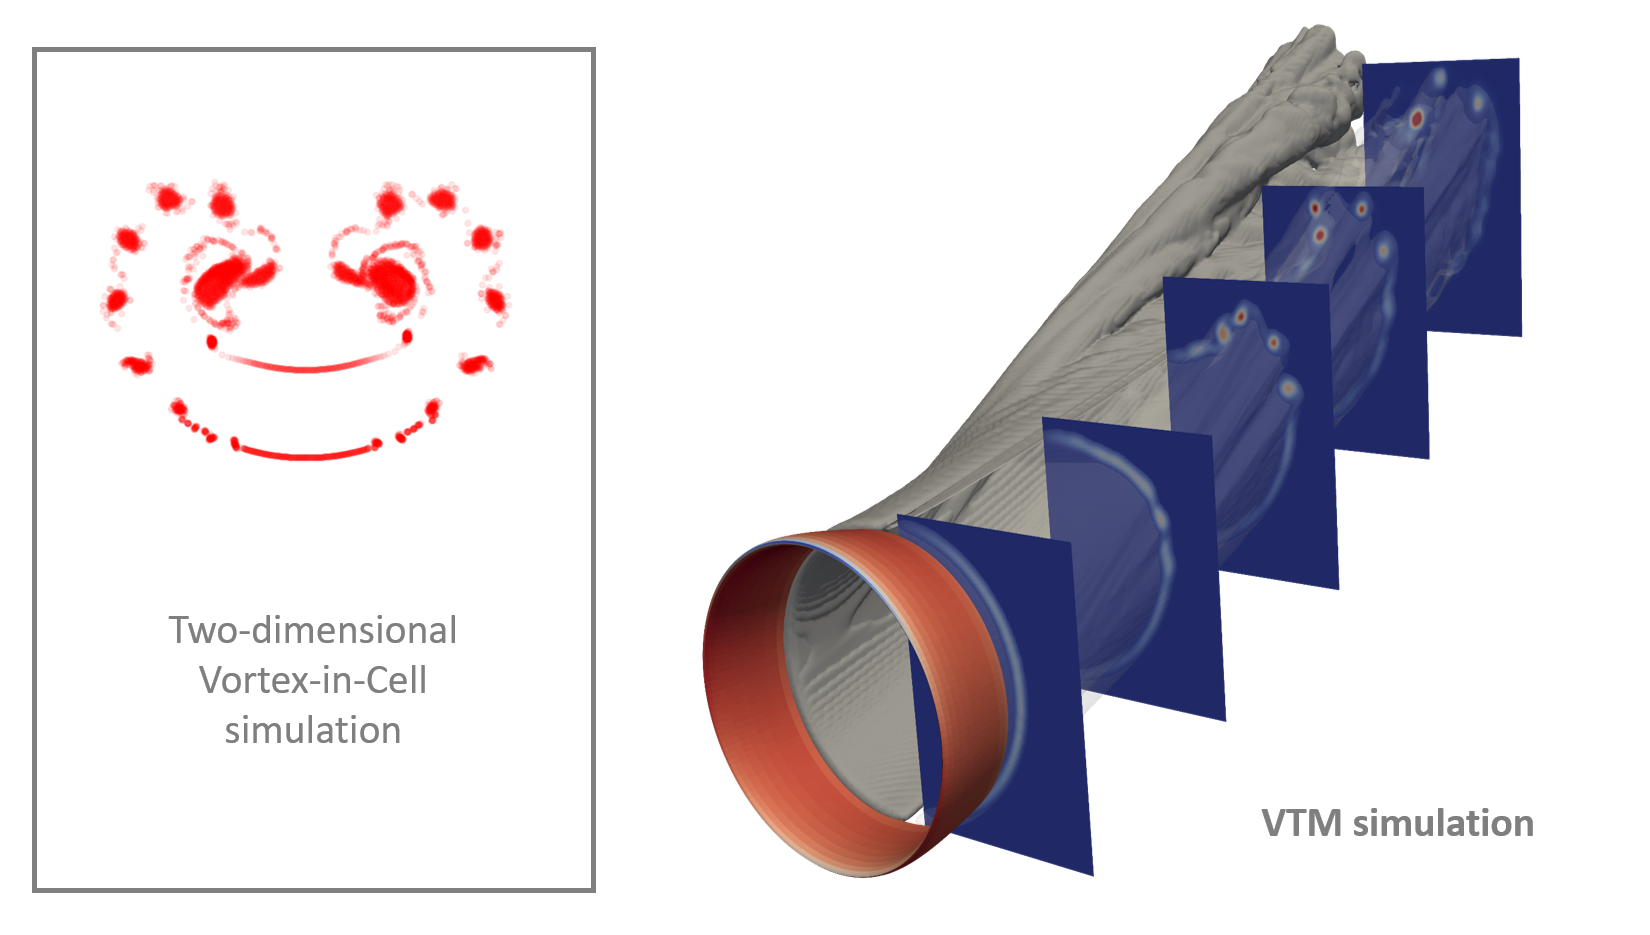
A secondary instability in the wake of a ring wing, as calculated using the Vorticity Transport
Model and verified using a simple 2-D Vortex in Cell calculation.
More information
The Vorticity Transport Method is especially adapted to yield accurate and very high-resolution insights into flows that are dominated by coherent vortex structures. These flows are typical, even characteristic, of the aerodynamics of wings, rotors and propellers.
The diagram at right shows the results of a VTM simulation of the wake that is formed downstream of a simple, isolated ring-wing, operating at a moderate angle of attack. The wake rolls up as expected to form two, larger, 'super-vortices' downstream of the wing, but the calculation also suggests the vortex sheet that is produced at the trailing edge of the wing to be subject to its own, more local instability. This instability causes the vortex sheet first to roll up to form a sequence of braided, individual 'trailing vortex cores' long before the 'super vortex' structure of the wake is able to establish itself.
A key question that the cautious modeller should always ask themselves when encountering instabilities in their numerical solutions is 'is this instability numerical in origin, or is it physical?'
To answer this question, a simpler analogue to the wake problem was analysed using a very simple numerical method, called the Vortex-in-Cell (VIC) method. The diagram at right shows the results of a VIC simulation of the two-dimensional dynamics of 64,000 vortex particles. In order to represent the geometry and strength of the wake of the ring-wing at its inception, the vortex particles were arranged initially to lie in a circle, and their strengths were initialised to represent the sinusoidal variation with azimuth of the strength of the trailed wake of the ring wing.
The VIC simulation shows clearly the same general behaviour as the VTM solution, with the braided vortex cores forming at very similar locations around the azimuth of the wake tube in both cases, despite the fairly large differences in detail between the two simulations.
The existence of these two mutually-supporting sets of results lends credence to the belief that the instability of the wake sheet is a real, physical effect rather than an artifact of the numerical solution. The next step in supporting this contention might, for instance, be to conduct a rigorous analytic stability analysis of the two-dimensional analogue to the real vorticity distribution in the wake of the wing.
Once the existence of this instability is verified to the satisfaction of those involved in the study, more practical questions might then be asked such as 'what impact would such instability in the wake have on the drag of the wing or on its dynamic characteristics?' - or, from a more fundamental perspective, 'do we see similar such instabilities in the wakes of planar wings?' (in which case the answer would appear to be 'yes!').
❮
more examples
❯
Verification of the VTM's unsteady aerodynamic model.
More information
Capturing the unsteady aerodynamic behaviour of a helicopter rotor is a extremely complex process, requiring the dynamics of the circulation on the rotor blades, the dynamics of the vorticity in the rotor wake and its interaction with the individual blades of the rotor as well as the structural dynamics of the rotor blades in response to the changing aerodynamic loads to be captured correctly.
Carpenter and Fridovich, in a foundational experiment conducted in 1953 (see NACA TN-3044), showed that, following a sudden increase in the collective pitch that is applied to the rotor blades, the inflow through the rotor would take some time to build up as the wake tube established itself below the rotor. As a result, the thrust produced by the rotor would initially overshoot before relaxing back to its steady-state value.
The diagram at left shows how the VTM is able to reproduce this effect very closely in a simulation that matches one of Carpenter and Fridovich's experimental cases. The quality of the comparison is bedeviled however by an inadequate characterisation of the structural properties of the rotor blades that were used in the experiment.
The figures at right show simulation results for the simplified case where the blades are treated as rigid and inflexible, and hence only the aerodynamic characteristics of the system play a part in the rotor's response to a sudden change in the collective pitch of the rotor blades. The predictions of the VTM are shown to match very closely those of a general-purpose high-resolution Reynolds-Averaged Navier-Stokes (RANS) solver for the variation of the rotor thrust with time.
Carpenter and Fridovich's experiment also informed the development of a very simple low-order model for the dynamics of the inflow through the rotor, called, simply, the Dynamic Inflow Model (see the works of Peters et al.). The diagrams at right show how effective this reduced-order model is at capturing the fundamental response of the rotor to changes in its aerodynamic loading.
The step-like features in the variations of thrust and inflow with time in the diagrams at right are the result of interactions between the rotor blades and the starting vortices that are left behind in the flow as the blades begin to produce lift. The dynamics of these vortices are fully represented in the VTM, somewhat less-adequately represented by the RANS code and missing entirely from the Dynamic Inflow Model.
This simulation thus provides an ideal example of the conundrum that often faces the practising engineer regarding which formulation to use to solve a particular problem: the Dynamic Inflow Model is cheap and fast, but represents the physics in an approximate and incomplete way. RANS solvers are readily available, represent the physics reasonably well and are based on a first-principles description of the fluid mechanics, but are expensive to run. The VTM is accurate and reasonably fast to run in this particular instance, but is specialised to solve this particular type of problem and thus requires some expertise to set up.
The best solution to this type of conundrum always depends on the particular characteristics of the problem at hand. Once properly calibrated, the Dynamic Inflow model is ideal for basic flight simulation or design-level studies. At the opposite end of the spectrum, the VTM comes into its own where prior knowledge is lacking and a more fundamental approach to analysing the problem is required.
We have found, at least in the context of aircraft design, that often a very effective approach is to use the VTM first to calibrate a simpler model such as Dynamic Inflow for use in performing the various parametric studies and tradeoffs that are necessary, and then to use the VTM judiciously again at various strategic intervals to perform a series of spot-checks on the validity of the data that is being produced.
❮
more examples
❯
VTM calculation of the aerodynamic interaction between a propeller and a wing.
More information
With the rise in interest around the globe in electric VTOL aircraft, attention is once again being focused on various aerodynamic methods for increasing the lifting capability of the vehicle - such as wing-blowing and thrust augmentation using ducts. The hope is that these approaches will provide large gains in performance for minimal sacrifice in terms of the mechanical complexity of the aircraft. While this goal might be achievable in ideal circumstances, some of the associated aerodynamic side-effects can be highly nonlinear and difficult to model. Thus the full ramifications of the design might not be captured in subsequent analyses of the likely performance of the aircraft, let alone in more sophisticated assessments of traditionally second-order effects such as the likely handling qualities of the aircraft in flight.
The figure above shows a VTM simulation of the flow that is produced when a rectangular, mid-aspect ratio wing is placed directly within the slipstream of a three-bladed propeller. The aim of such a configuration is to increase the dynamic pressure, and hence the lift that is generated by the portion of the wing that is immersed in the propeller wake. The sheet of vorticity that is created in the wake of the wing is shown in a light grey colour, while the vorticity in the wake of the propeller is shown in yellow. The unsteady component of the pressure field that is induced on the wing by the passage of the individual tip vortices within the propeller wake is superimposed as a colourmap onto the surface of the wing.
The spanwise shear associated with the trailed vorticity in the wake of the wing acts to dislocate the stream-tube of the propeller into an ovoid, almost figure-of-eight geometry downstream of the wing. Similarly, the circulation around the wing acts to retard the flow in the propeller streamtube below the wing and to accelerate it above the wing. These effects together act to re-direct the wake of both the wing and the propeller in a way that is dependent in a very complex way on the thrust that is being produced by the propeller and the lift that is being produced by the wing.
The concern for the designer might be that if any other devices are located downstream of the wing, for example tail surfaces - or additional lifting rotors in the case of an eVTOL aircraft perhaps - then these devices will be immersed in a complex, non-linear flow, the characteristics of which are very likely to be highly dependent on the flight condition of the aircraft. In these cases the benefits of 'clever' aerodynamic design need to be weighed up against their impact on the performance of the aircraft, or against the danger of creating a system with flight dynamic characteristics that are somewhat less linear and predictable than ideal.
❮
more examples
❯
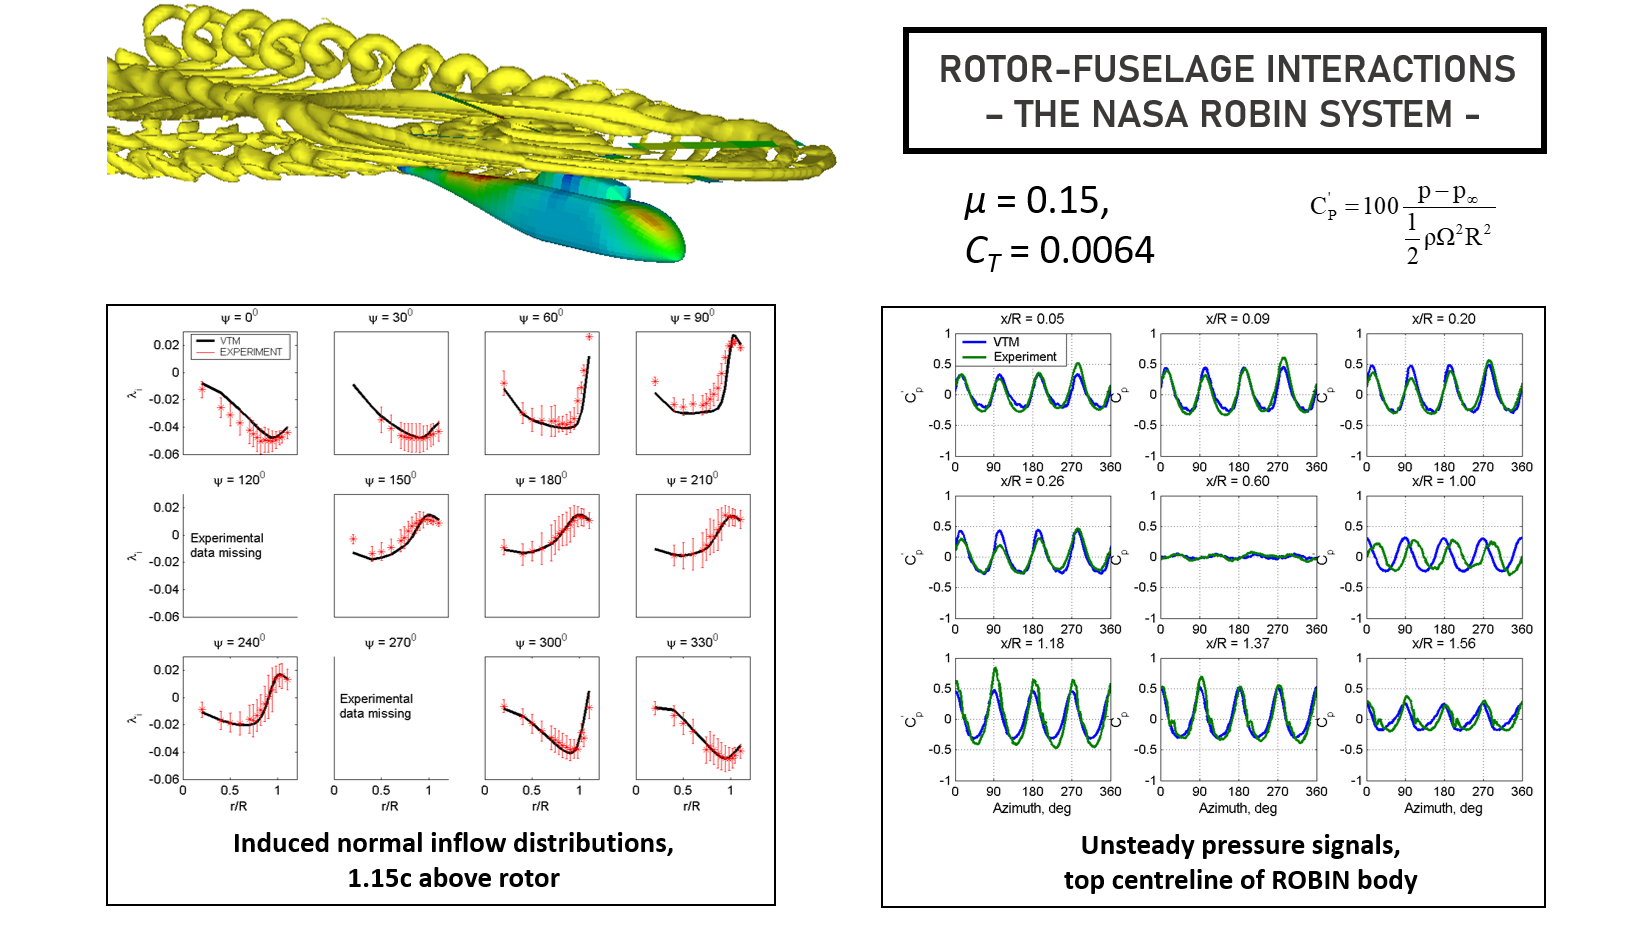
Verification of the VTM's ability to predict in detail the characteristics of rotor-fuselage
interaction.
More information
The aerodynamic interaction between the rotor blades and the fuselage has been the source of trouble in the development of several well-known helicopter types, starting from the earliest days of rotary winged flight all the way to the present day. An ability to predict accurately the unsteady pressure loads on the fuselage that are caused by the overpassage of the rotor blades would have helped considerably in saving the helicopter industry from some very expensive historical mistakes. Future rotorcraft programmes would also benefit considerably from such a predictive capability, which would allow vehicles to be designed specifically to avoid the dynamic and acoustic problems that can arise from this form of interaction.
During the 1980s, NASA built up a comprehensive, high quality set of wind-tunnel measurements of the flow around a particularly closely defined combination of rotor and fuselage. Although the dataset is not without its problems, these ROBIN measurements continue to be one of the prime benchmarks against which the ability of numerical models to capture the salient aerodynamic features of rotor-fuselage interaction can be judged.
The figure shows a comparision of the VTM's predictions of the downwash below the rotor at various azimuthal locations, as well as the pressure signatures of the blades at various locations on the fuselage, as compared to some of the ROBIN data. The distribution of inflow is predicted to a high degree of accuracy throughout, as is the pressure signal at the various measured locations on the fuselage. A curious anomaly is seen at x/R=1.56, however, where the pressure signal is predicted with the same amplitude but quite a distinct phase shift compared to the experimental data.
Parts of the ROBIN dataset had to be post-processed to remove the effects of time-lags in the equipment used to measure the pressures. Despite our best efforts to isolate any errors in the setup of our simulation, our best guess to date is that the measurements for this particular point on the fuselage simply escaped this crucial step before being included in the experimental database.
Based on this and similar experiences, Sophrodyne's key advice to clients is always that an experimental campaign never be conducted simply to 'gather data' without having a very good prior understanding of what the data should actually look like. Indeed, we believe that a particularly effective risk-mitigation strategy against the possibility of very large additional expense and significant time-wastage in experimental work is first to construct a mathematical model of the experiment, even if this model is initially rather rudimentary and incomplete (as it most likely will be at first, given that one of the purposes of gathering the data should usually be to improve the quality of the model of the system being tested).
This model should be kept close at hand during the experiment so that measurements can be checked for sanity against its predictions in as close to real time as possible - and certainly before the time allocation for the test runs out and the experimental setup is dismantled!
❮
more examples
❯
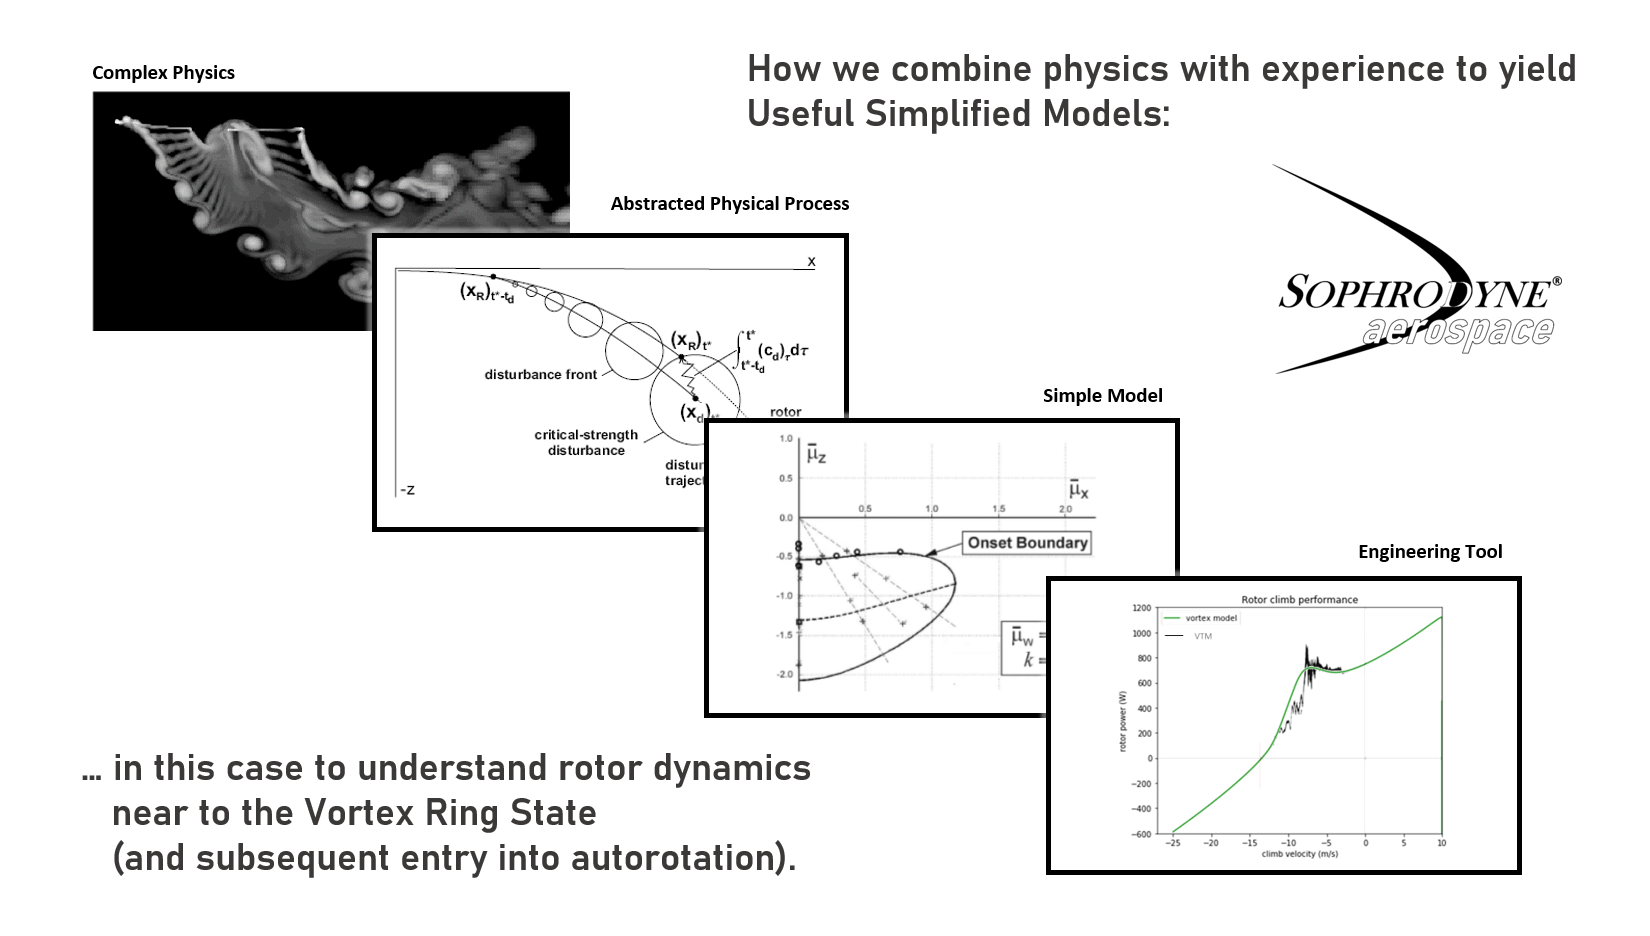
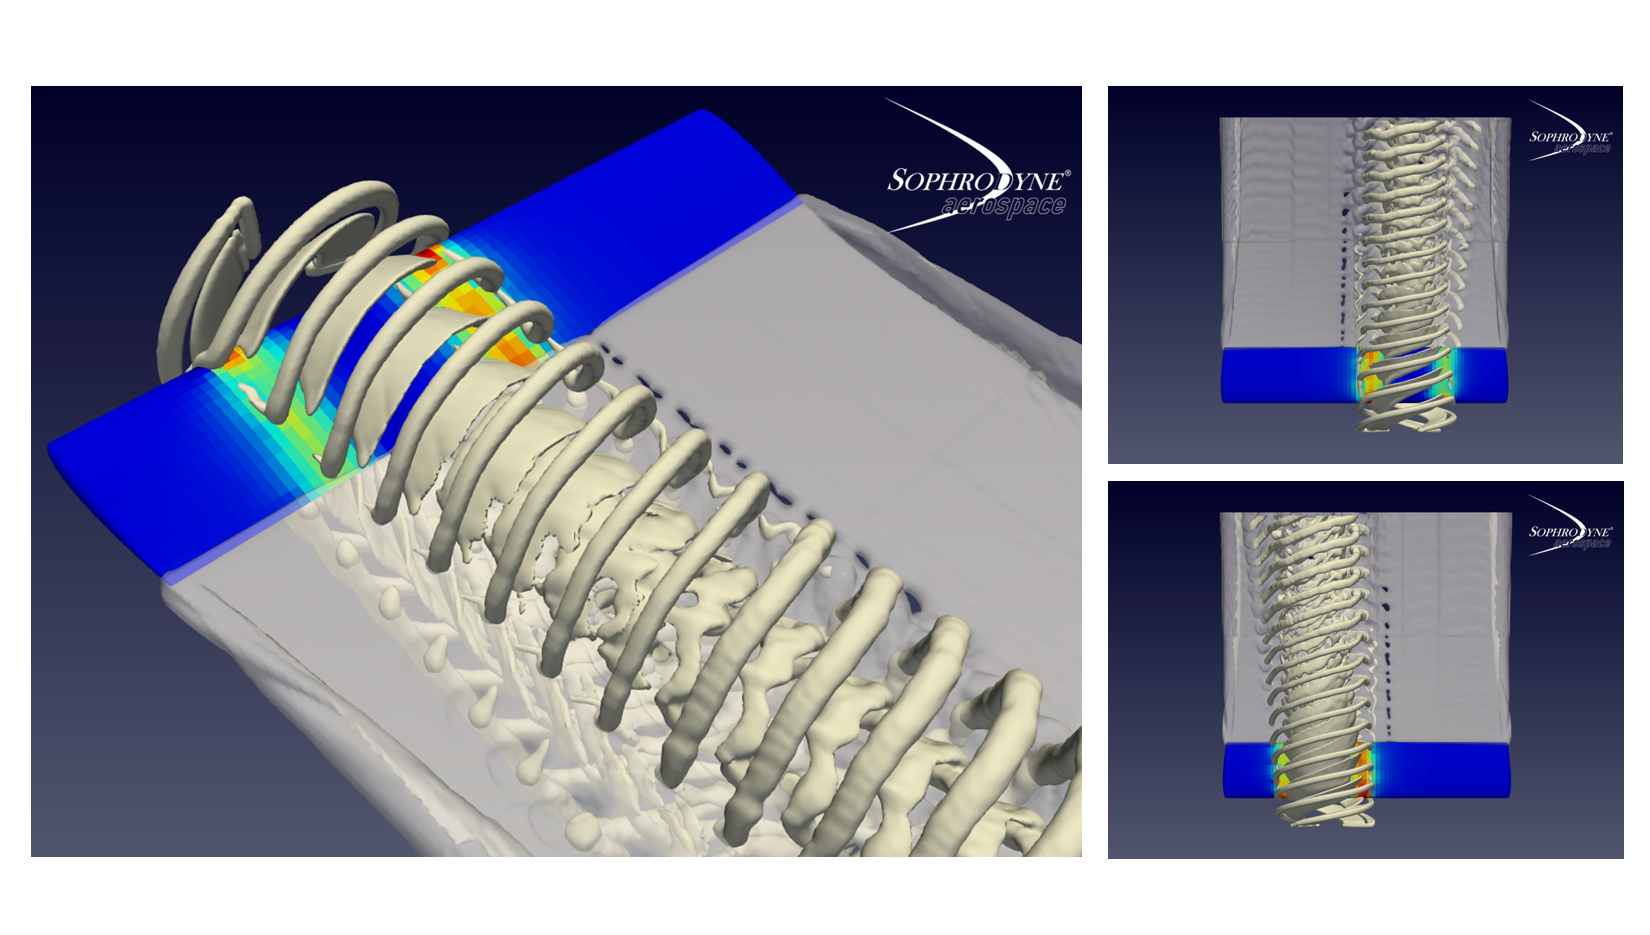
An illustration of Sophrodyne's technical approach - here to understand and predict the onset
of the Vortex Ring State.
More information
This figure gives an example of the approach that we often follow at Sophrodyne Aerospace in trying to understand and characterise an aerodynamic issue that might be causing significant problems in the development of a particular airframe. The context in this particular example is the unexpected re-appearance of a pernicious wake instability, called the Vortex Ring State, during the initial operational tests of the V-22 Osprey tilt-rotor aircraft in the early 2000s. At the time the origins and cures for this instability were not well understood in terms of the underlying fluid dynamics.
The upper figure shows a sample VTM simulation of the geometry of the wake of a helicopter rotor under 'normal' forward-flight conditions. In this figure, the presence of a natural instability in the rotor wake, causing the individual vortices from each of the rotor blades to roll up into larger structures, can be seen quite clearly. Calculations such as this suggested that the dynamics of the instability in the wake might be treated theoretically using the simplified model shown in the second diagram from the top. The products of the instability grow in size, but at the same time convect away into the flow downstream of the rotor. It can be imagined that a critical flight condition exists where the products of the instability grow faster than they are swept away downstream - in which case they coalesce at the rotor and disturb the process whereby the aerodynamic loads are generated on the system.
if this model is followed to its logical conclusion, then the envelope shown in the third figure from the top can be produced. The lobe-shaped area corresponds to those combinations of forward speed and descent rate at which the rotor wake is likely to collapse into the recirculatory form that is characteristic of the Vortex Ring State, and thus where the associated flight dynamic problems on the airframe are likely to emerge. This diagram is inherently useful - it can be used to predict the likely behaviour of a helicopter rotor given its size and the load that it is intended to carry. The parameters within the model are sensitive to the more detailed design characteristics of the rotor such as the twist of its blades, allowing the simple model to be adapted to match quite closely the characteristics of the vehicle of interest.
The final stage of the process is shown in the figure at bottom right. The theoretical model is re-cast as a set of ordinary differential equations that can be added to a standard helicopter flight mechanics toolbox to allow the effects of the Vortex Ring State to be incorporated into simulations of the behaviour of the vehicle. In this particular figure, the predictions of the dynamic model are compared against the torque that the rotor is predicted by the VTM to require at constant thrust as the flight conditions of the rotor are changed from operating in climb to operating in a rapid descent.
The dynamic model captures very well the gross characteristics of the variation of the torque on the rotor as the vertical speed of the system is varied, and has proved to be very useful in a number of recent applications.
❮
more examples
❯
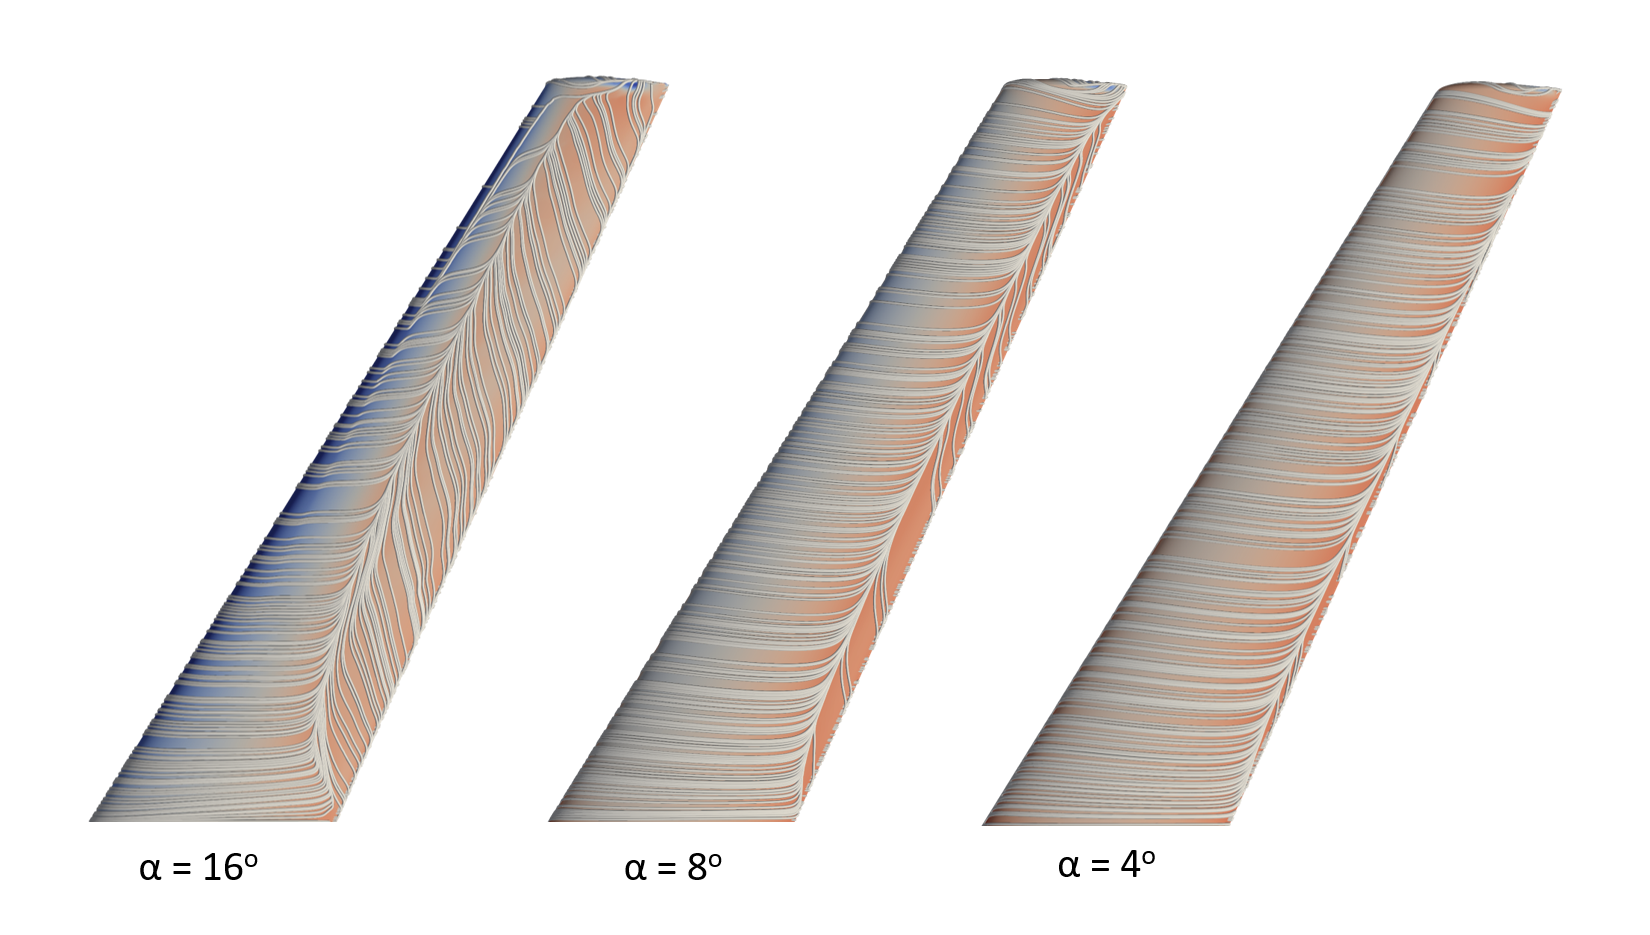
Shear lines on the surface of a swept wing at three different angles of attack.
More information
Much can often be learned, and the limitations of one's understanding explored, by attempting to simulate the characteristics of a reasonably simple and supposedly well-understood aerodynamic system using a modern, high-performance numerical solver. As an exercise in this vein, this figure shows the results of a calculation, using Sophrodyne's Reyolds-Averaged Navier Stokes CFD solver, of the flow pattern on the surface of a swept wing with moderately high aspect ratio at three different angles of attack to the oncoming flow.
At four degrees angle of attack, the flow on the wing is attached except within a small region near the trailing edge of the mid-span of the wing. As the angle of attack is increased, this separation bubble grows, and the wing's ability to produce lift is disrupted as the classical flow pattern that is characteristic of trailing-edge stall establishes itself. The careful observer will also notice some interesting secondary flow features in the diagram for the wing at sixteen degrees angle of attack, including evidence for a small pocket of separated flow at the leading edge of the most outboard parts of the wing as well as a secondary separation bubble further inboard near the trailing edge in which the flow is rotating counter to the main separation bubble.
A common misconception, repeated in many textbooks, is that the flow near the surface of a swept wing is generally outboard, even when the wing is essentially un-stalled - and thus that the associated accumulation of 'dead air' near the wing tips is responsible for the eventual stall of the wing. The results of the calculations shown in this figure suggest that this is not a a particularly accurate portrayal of the flow physics.
In aerodynamics one has always to be very wary of 'chicken-and-egg' type arguments. It is clear that where the flow is attached, especially over the forward parts of the wing, the direction of the surface streamlines is generally parallel to the chord, or even slightly inwards towards the root of the wing. Outwards movement of the air is associated with its deceleration towards eventual separation, and, indeed, within the separation bubbles the flow has a distinct outwards component, but it is important not to confuse correlation with causation!
❮
more examples
❯
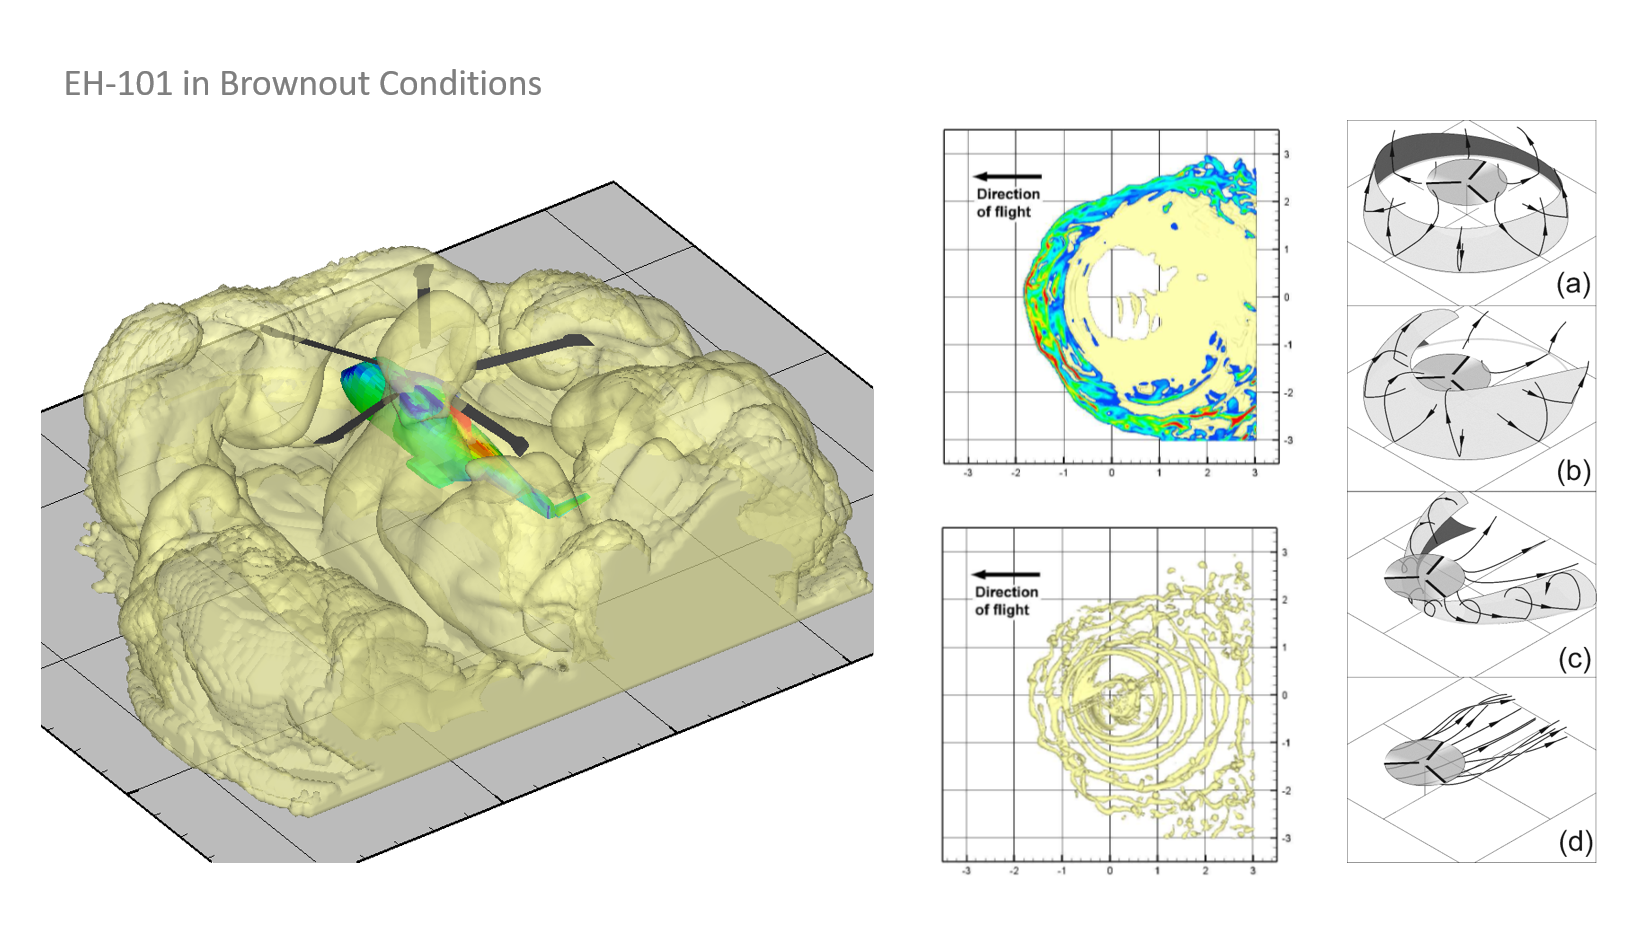
VTM calculation of the properties of the dust cloud that is created by a helicopter when
operating in brownout conditions.
More information
Helicopter operators in desert or sandy conditions often experience considerable problems with the uplift of sand by the downwash from the rotors as their helicopters came in to land. The sand tends to obscure the pilot's vison of the ground and nearby obstacles at precisely the moment of touchdown in a dangerous phenomenon known as 'brownout'.
The traditional approach to modelling the evolution of the rotor-induced cloud of sand that is produced under brownout conditions generally relies on modelling the the dynamics of a small set of individual 'test particles' that supposedly represent the composition of the cloud. The approach used to generate the figures above uses a more efficient computational approach which integrates readily within the computational framework of Sophrodyne's Vorticity Transport Model. The method relies on a re-analysis of the basic equations of motion of the sand particles, using an approach that is based on the statistical mechanics of a large number of indistinguishable elements.
The diagram at left shows a simulation of the dust cloud that might be generated in the air surrounding an EH-101 helicopter as it moves at low altitude and speed across a dusty surface. The figures at centre contrast the positions of the tip vortices on the ground at one particular instant (for a two-bladed rotor where it is easier to see the salient physics at work) with the locations of the regions on the ground where the entrainment of the sand into the air is most intense. It is clear that the entrainment process is strongly correlated with the positions and strengths of the vortices in the rotor wake as they impact the ground (although a little more obscurely than initially might have been imagined). This suggests a possible route to mitigating the effects of brownout - at least to some extent - by paying careful attention to the flight profile that is flown when the helicopter is close to the ground.
Indeed, the figures at right provide a schematic view of our understanding of the shape and size of the brownout cloud and its relation to the geometry of the rotor wake. It is well-known since the pioneering work of Curtiss in the 1980s that the wake of a helicopter rotor, when flying close to the ground, undergoes several distinct changes in morphology as the speed of the helicopter is varied. These changes correlate very well with the changing structure of the brownout cloud as the speed of the helicopter is changed, but the connection can be obscured considerably in practice by the long-term 'memory' of the dust cloud that comes about because of the very long times that the smallest (and typically most optically-active) particles take to settle back to the ground once entrained into the air.
❮
more examples
❯
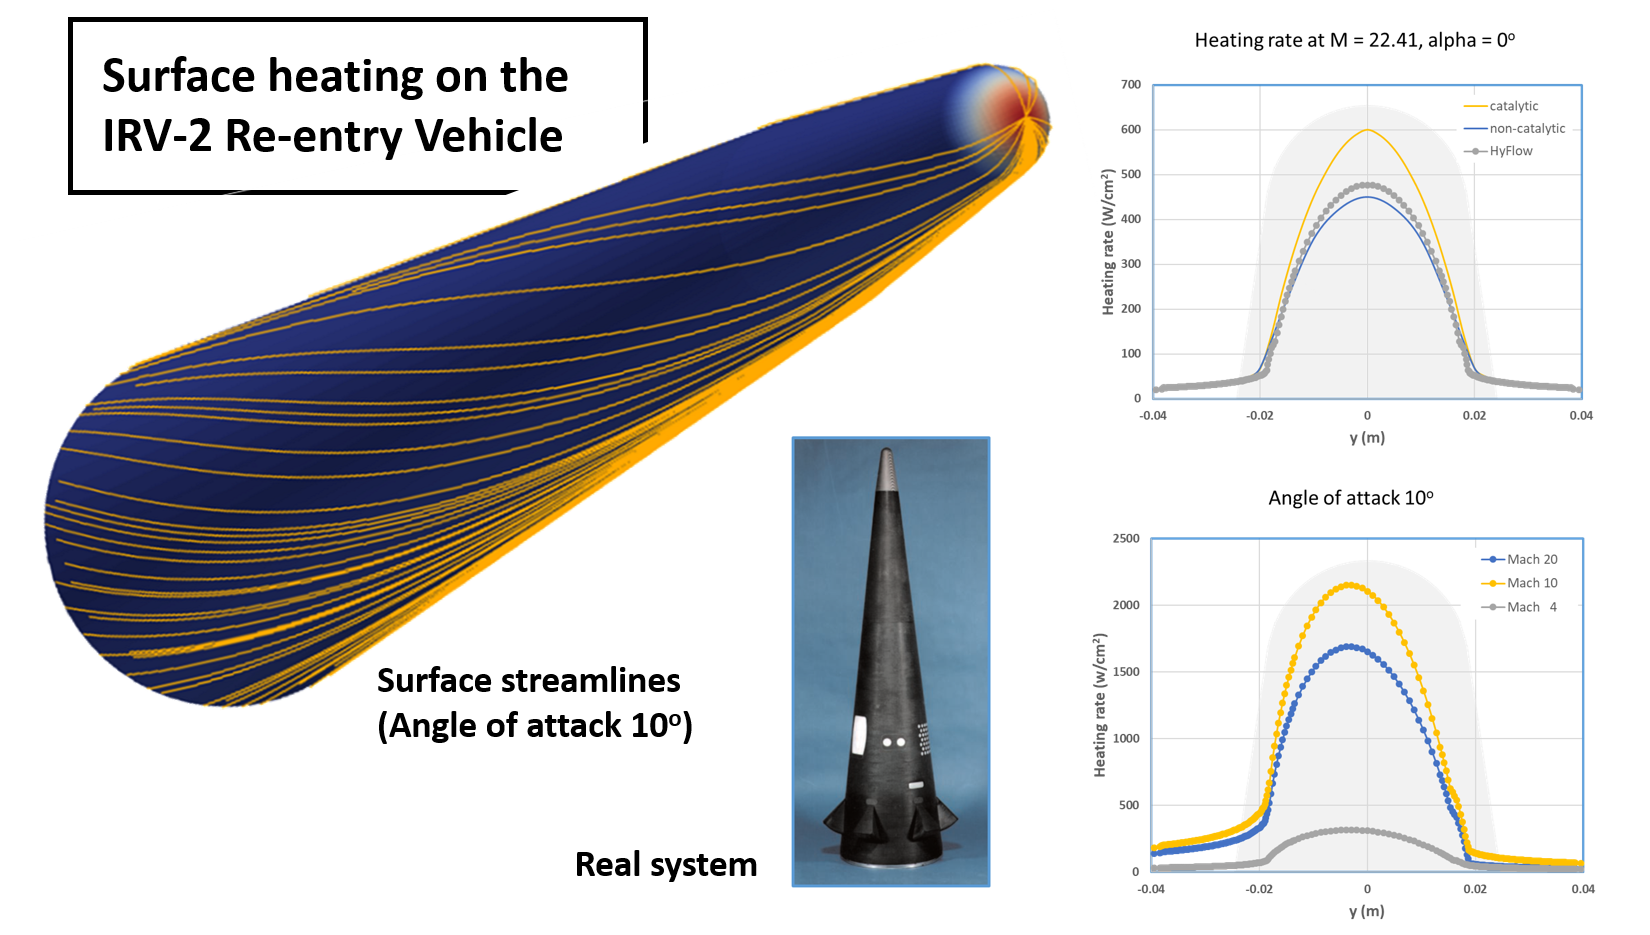
Prediction of the heating near the blunt nose of the IRV-2 re-entry vehicle when entering
the atmosphere at hypersonic speed.
More information
The most intense heating on a vehicle re-entering the earth's atmosphere takes place just behind the strong shock wave that invariably lies just upstream of the vehicle's leading edges. Contrary to what might be expected, the design solution that yields the lowest heating is one where the leading edges are blunt rather than sharp. Unfortunately, the blunter the leading edges, generally the greater the drag, so for a vehicle that is required to travel long distances within the atmosphere a compromise has to be struck.
In this set of figures we show predictions of the heating rate near the nose of the IRV-2 re-entry vehicle, as calculated our Hyflow model. This model relies on the Newtonian Flow Approximation to give very rapid predictions of the aero-thermodynamics of hypersonic vehicles compared to more conventional approaches based on the Navier Stokes or Boltzmann equations. As such, Hyflow is an ideal tool for parametric design studies or first-pass quantification of the likely aero-thermodynamic characteristics of any prospective hypersonic vehicle.
The diagram at top left shows the streamlines over the surface of the IRV-2 re-entry body when flying at just over twenty-two times the speed of sound while at an angle of attack to the oncoming flow of 10 degrees. All the streamlines on the surface of the vehicle at this angle of attack emanate from a stagnation point near the nose. The heating on the vehicle is the highest at this point.
The diagram at top right shows a comparison of the predictions of the Hyflow model against two sets of data generated using more sophisticated CFD-based numerical approaches. In the first instance (the catalytic case) the chemistry of the interaction between the surface of the vehicle and the hot gas layer behind the shock is accounted for and, in the second, this physical effect is neglected. The hyflow model in this case contains no representation of the gas chemistry and can be seen to reproduce most closely the numerical results for the non-catalytic surface.
The diagram at the bottom right shows the variation of heating near the nose of the IRV-2 vehicle, as predicted by Hyflow for various Mach numbers with the vehicle flying at ten degrees angle of attack. The advantage of the Hyflow simulation is that it was able to produce results within seconds rather than the hours taken to converge a full CFD-based solution, and the results shown here can be used to infer the very large changes in heating rate that will be encountered, particularly near the nose of the vehicle, as it decelerates in response to the frictional and pressure forces that are produced on its surface as it descends through the atmosphere.
❮
more examples
❯
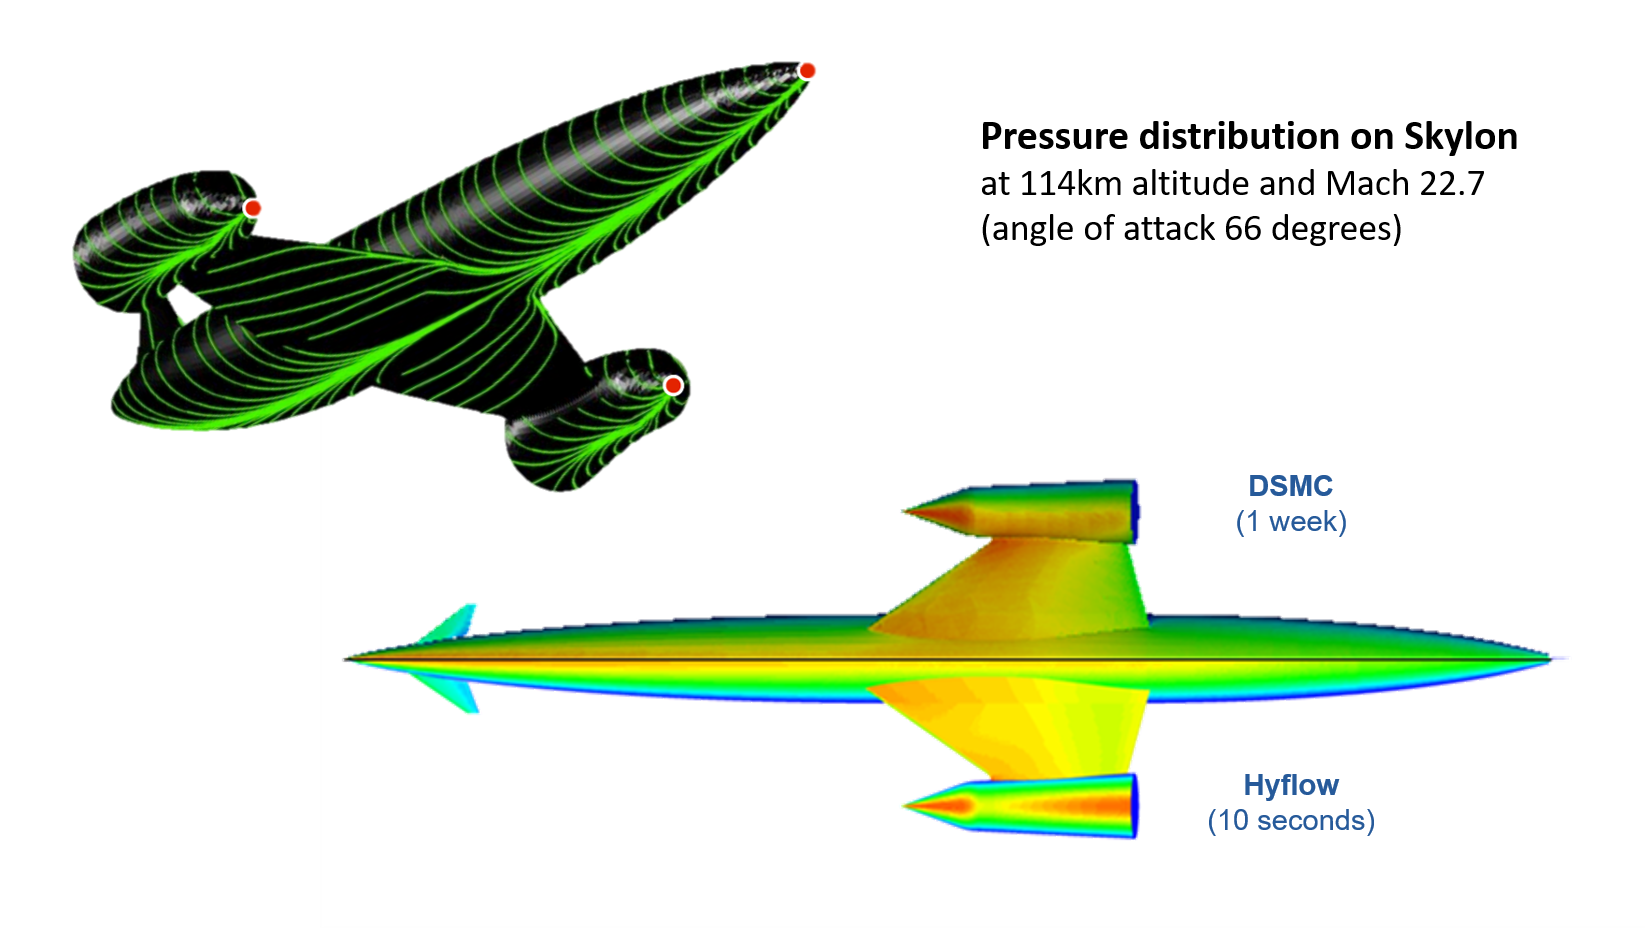
Pressure distribution on the surface of the Skylon vehicle when flying hypersonically at high
altitude, comparing the predictions of a Direct-Simulation Monte Carlo method and the Hyflow
reduced-order model.
More information
The Skylon spaceplane is intended to launch from a runway and to accelerate into space using a hybrid rocket-airbreathing propulsion system. Once having delivered its payload into orbit, the vehicle glides back to a landing at the same airport from which it took off. Although somewhat eclipsed by recent advances in more conventional rocketry, the premise of such a vehicle is that its unique mode of operation could make access to space cheaper and more routine than traditional expendable rocket technology.
One of the major design challenges is to create a configuration that, on re-entering the earth's atmosphere, can dissipate the very large energy associated with an orbital vehicle without overheating, but at the same time can have good enough aerodynamic performance to be able to glide all the way back to its launch site. The solution adopted by Skylon is to minimise the heating by pitching the vehicle nose-up to present its flat underbelly to the flow during the high-speed portion of the re-entry, and then to return to a more level attitude to continue its glide to its landing site with an aerodynamic efficiency that is similar to that of a slender supersonic transport aircraft.
Analysis and optimisation of the performance of such a vehicle requires thousands of evaluations of its aerodynamic characteristics at various points along its trajectory. Traditional methods of aerodynamic analysis based on the Navier Stokes or Boltzmann equations are just too slow in such applications, often requiring hours or even days to produce a single data point. Our Hyflow methodology makes use of the Newtonian Flow approximation to give very rapid predictions of the aero-thermodynamics of hypersonic vehicles compared to these more conventional approaches - indeed, predictions take seconds rather than hours.
Of course speedy but inaccurate predictions are of little use to anybody. The figure shows a comparison, conducted as part of the verification of the simpler model for use in optimising the re-entry trajectory of Skylon and similar vehicles, of Hyflow's predictions of the pressure distribution over the surface of Skylon (when operating at high altitude and Mach number in its nose-high mode) to similar results obtained using the Direct Simulation Monte Carlo approach.
The principal differences between the predictions are relatively localised in extent - for instance, Hyflow, in not modelling explicitly the positions of the shock waves in the flow, misses features in the pressure field such as the small patch of elevated pressure where the shock that is produced upstream of the nacelle interacts with the outboard part of the wing. Despite these localised discrepancies in prediction, the integrated loads on the airframe - in terms of lift, drag and moment about the centre of gravity - turn out to be very similarly predicted by both approaches.
Since it is these integrated loads that have direct effect on the dynamics of the vehicle, the aerodynamic predictions of the simpler model are usually accurate enough for a design-level determination of the best control strategy to adopt during re-entry into the earth's atmosphere. A series of initial simulations using Hyflow would be used to provide the basis for a more in-depth optimisation of the vehicle's characteristics, particularly of its heating (which is very much more directly dependent on proper resolution of localised features in the flow - such as those that are induced by shock-body interactions!) using more sophisticated methodologies once the design space had been properly explored and the simpler approach had been used to isolate a small set of promising solutions for closer study.
* Except where explicit permission has been obtained to release actual data, geometries and test conditions have generally been changed to protect the intellectual property of the sponsors of the original work.
News
⬤
Use the tab above to access the latest news from Sophrodyne Aerospace!
Articles
The tab above leads to a page containing various articles on aeronautical topics that we have written over the last years.
These are in addition to Dr Brown's published academic articles, a list of which can be found here.
Useful tools and downloads
Coming soon!
For the moment this tab will take you to our "Articles" page.
For the moment this tab will take you to our "Articles" page.
The tab above leads to a page containing some simple tools and downloads that may be of use to you in performing your own investigations.
Sophrodyne's Fundamental Approach
Our years of experience in combining numerics and theory lies at the core of Sophrodyne's way of working. We understand that an analysis of a problem using a brute force approach (such as is obtained for example with a pre-packaged general-purpose CFD code) is often necessary and useful in order to obtain basic data - for instance for evaluating a parameter or to validate a model - and we have the tools to do that.
We believe though that this approach only becomes cost-effective and valuable once these individual data are abstracted into a sensible mathematical framework which clearly expresses one's current understanding of the problem. Unlike "ideas" or "hunches", an explicit, simple mathematical model is a tangible object with which the human intellect can engage and interact. A good model allows the strength of your understanding of the problem to be exploited directly in being able to predict the properties of the system that are of interest to you. But often even more important is the fact that predictive errors in the same model are very often an indication of a deficiency somewhere in understanding the problem properly. The key advantage thus of the model-building process during the development of a product is that it invariably promotes the sort of interaction with the problem in which these lapses in understanding can be exposed and rectified before they can cause too much harm.
This is where the experienced practitioner will save you time and effort in achieving your goals.
We understand from first principles the methodologies that underpin most current commercial aerodynamic tools, and can advise regarding both their strengths and their weaknesses. In many instances we have our own analogue methodologies that we have written in-house and understand down to the last line of code. We can use these to perform genetically-independent sanity checks on, and independent verifications of, the data coming out of your models, or to perform the relevant analyses on your behalf. Indeed, over the years we have built up a series of models that work from very limited data to give reliable estimates of the most salient performance characteristics of a wide range of flight vehicles - from subsonic drones and helicopters, through mid-sized commuter aircraft, through to supersonic jets and even hypersonic re-entry vehicles!
We can also help you upgrade and develop your internal modelling capabilities, starting from a clean sheet of paper or based on what you already have available. You may be surprised to find out how broadly used our methodologies are within the aerospace community.
Most importantly, and this is where we specialise in bringing value to organisations such as yours, we can help you understand and generalise your proprietary data into models that can be used over and again, not only today but also in your future products, adding to your reserve of intellectual property and know-how as you develop your product line.
Please feel free to contact us to discuss your problems and requirements.
CONTACT US
▲︎
◀︎
Home
▶︎
© Sophrodyne Ltd 2015 - 2025